OSS-ESPA's wiretap solution allows you to monitor and manage voice, SMS, MMS, social media, and data communication, for example email, Web browsing and file downloads that you have been given legal permission to monitor.
When a voice call occurs, you can listen to it live while entering the call's synopsis. When the call is complete it appears in your Worklist, where you can then replay the recording and complete the call's associated tasks such as categorization, synopsis and transcript.
SMS, MMS, social media, data and fax calls are also displayed in your Worklist, allowing you to view them and manage the tasks associated with them.
If you have T50 permission for a queue then you can also auto record all communications and replay them at a later date.
This feature requires option E19 Sentinel content log. If you do not have this option this feature is not available.
This section of the Help describes how to use OSS-ESPA's Live Monitoring wiretap solution.
How are wiretap audio files verified for authenticity?
Wiretap audio file verification
The intercepted wiretap audio files are validated using Cyclical Redundancy Checking (CRC) hash verification, a process that generates a unique digital fingerprint, called a CRC hash, from the exact data in the recording at the time it was captured. This hash value is later recalculated and compared whenever the file is accessed or prepared for evidence. If any portion of the file had been altered, even by a single bit, the CRC hash would not match. Because all CRC hash values for the intercepted recordings remained identical from the time of interception through their submission into evidence, this confirms that the audio content has remained complete, authentic, and unaltered.
How to add a monitor and edit an existing monitoring queue
If you have already assigned monitors and wiretap lines to a queue but would like to change these settings, for example by adding another monitor or changing their permissions you can use these procedures.
You can add a edit a queue using the Editing queue screen which can either be opened from the Live monitoring screen or the main menu. You must first locate the monitoring queue you want to change the settings on. If you are already using the Live monitoring screen the first method is recommended as it takes you directly to the queue.
using the Live monitoring screen:
On the Live monitoring screen, select the subject then click the queue management icon .
The Editing queue screen opens.
using the main menu:
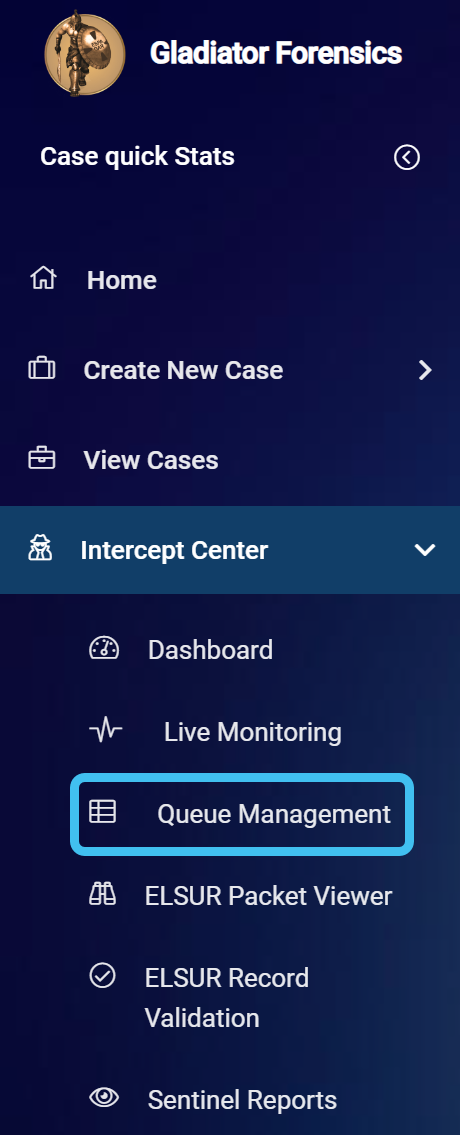
On the main menu click Intercept Center, then click Queue management.
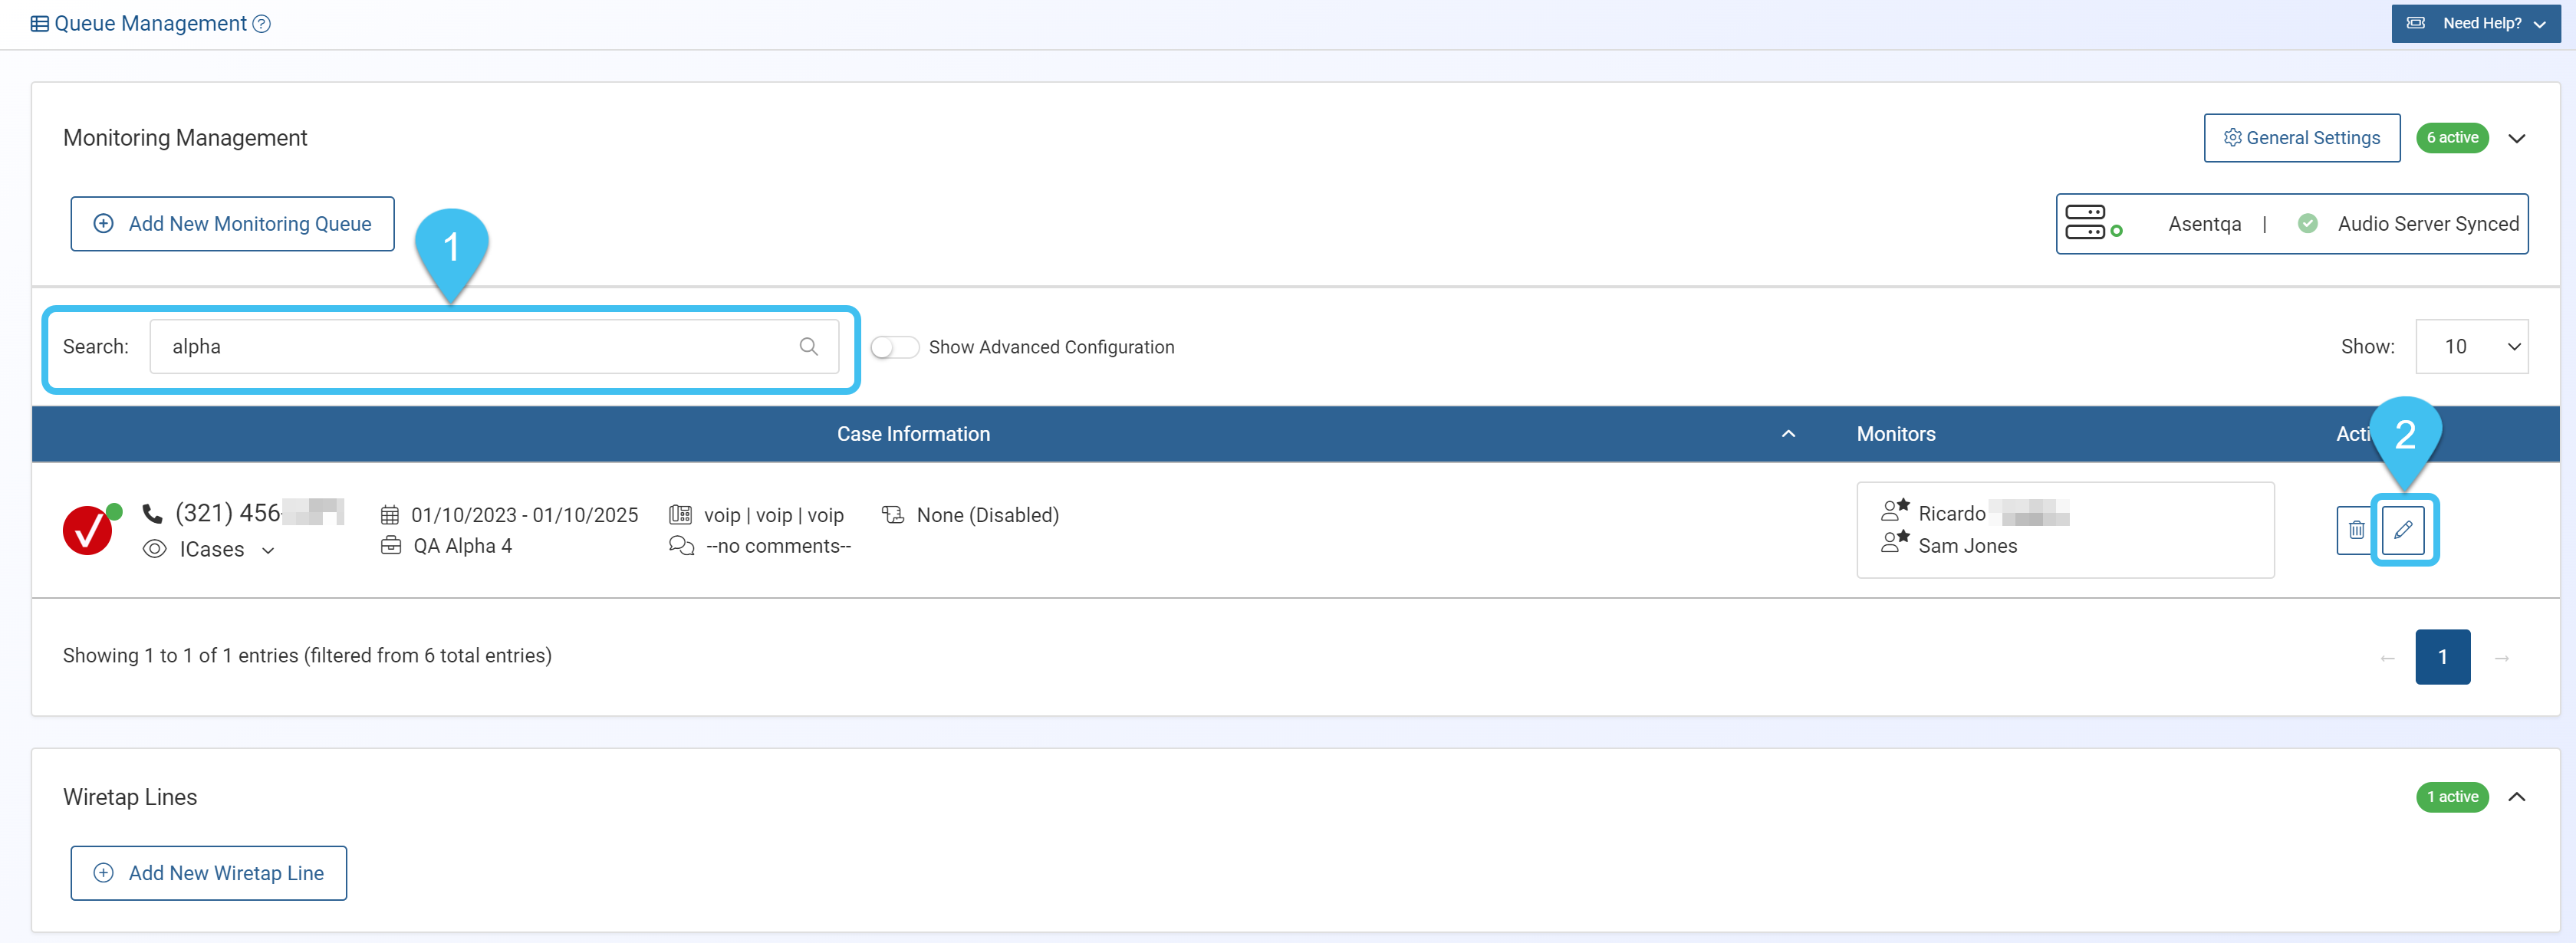
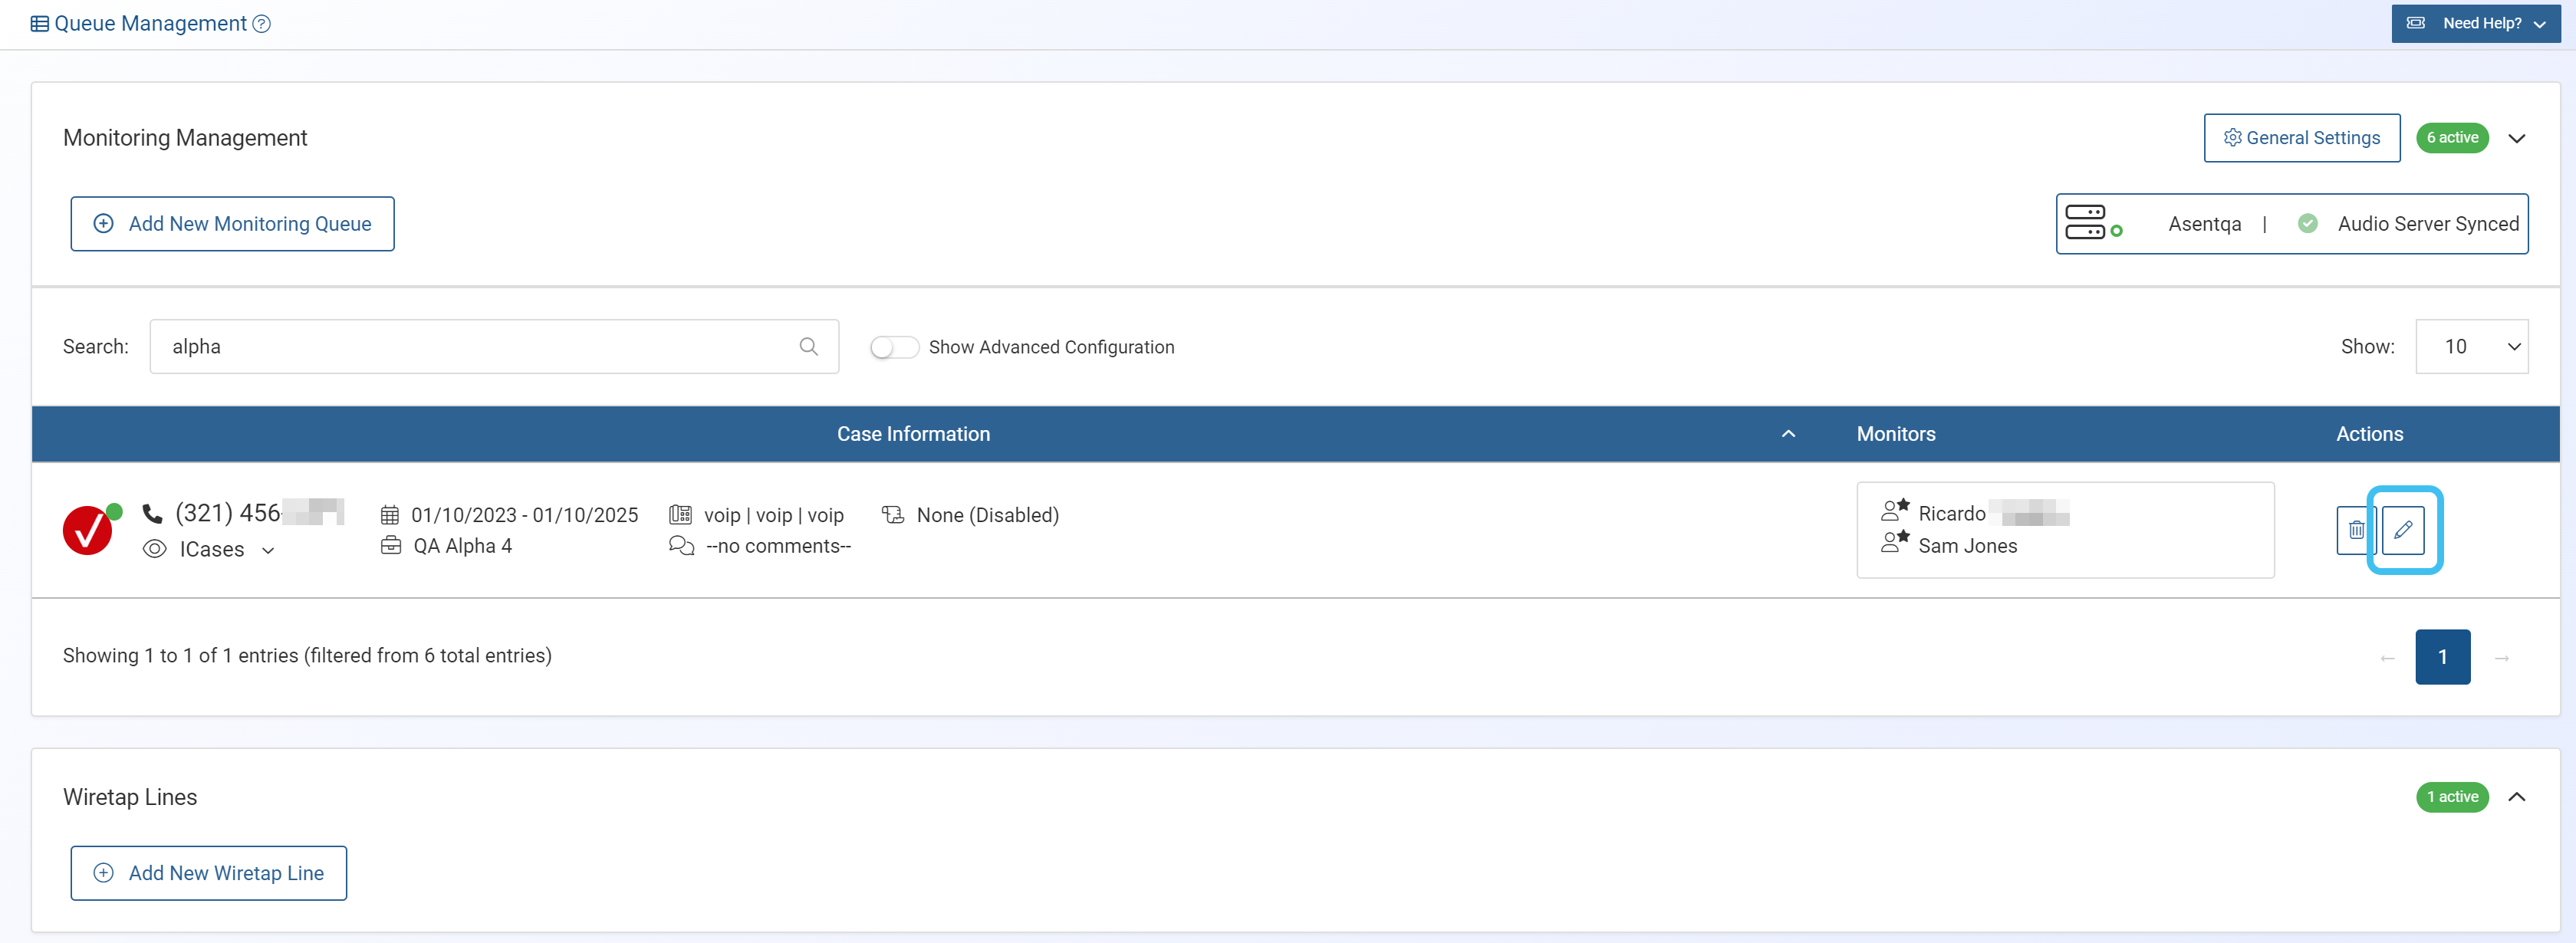
The Queue management screen opens.
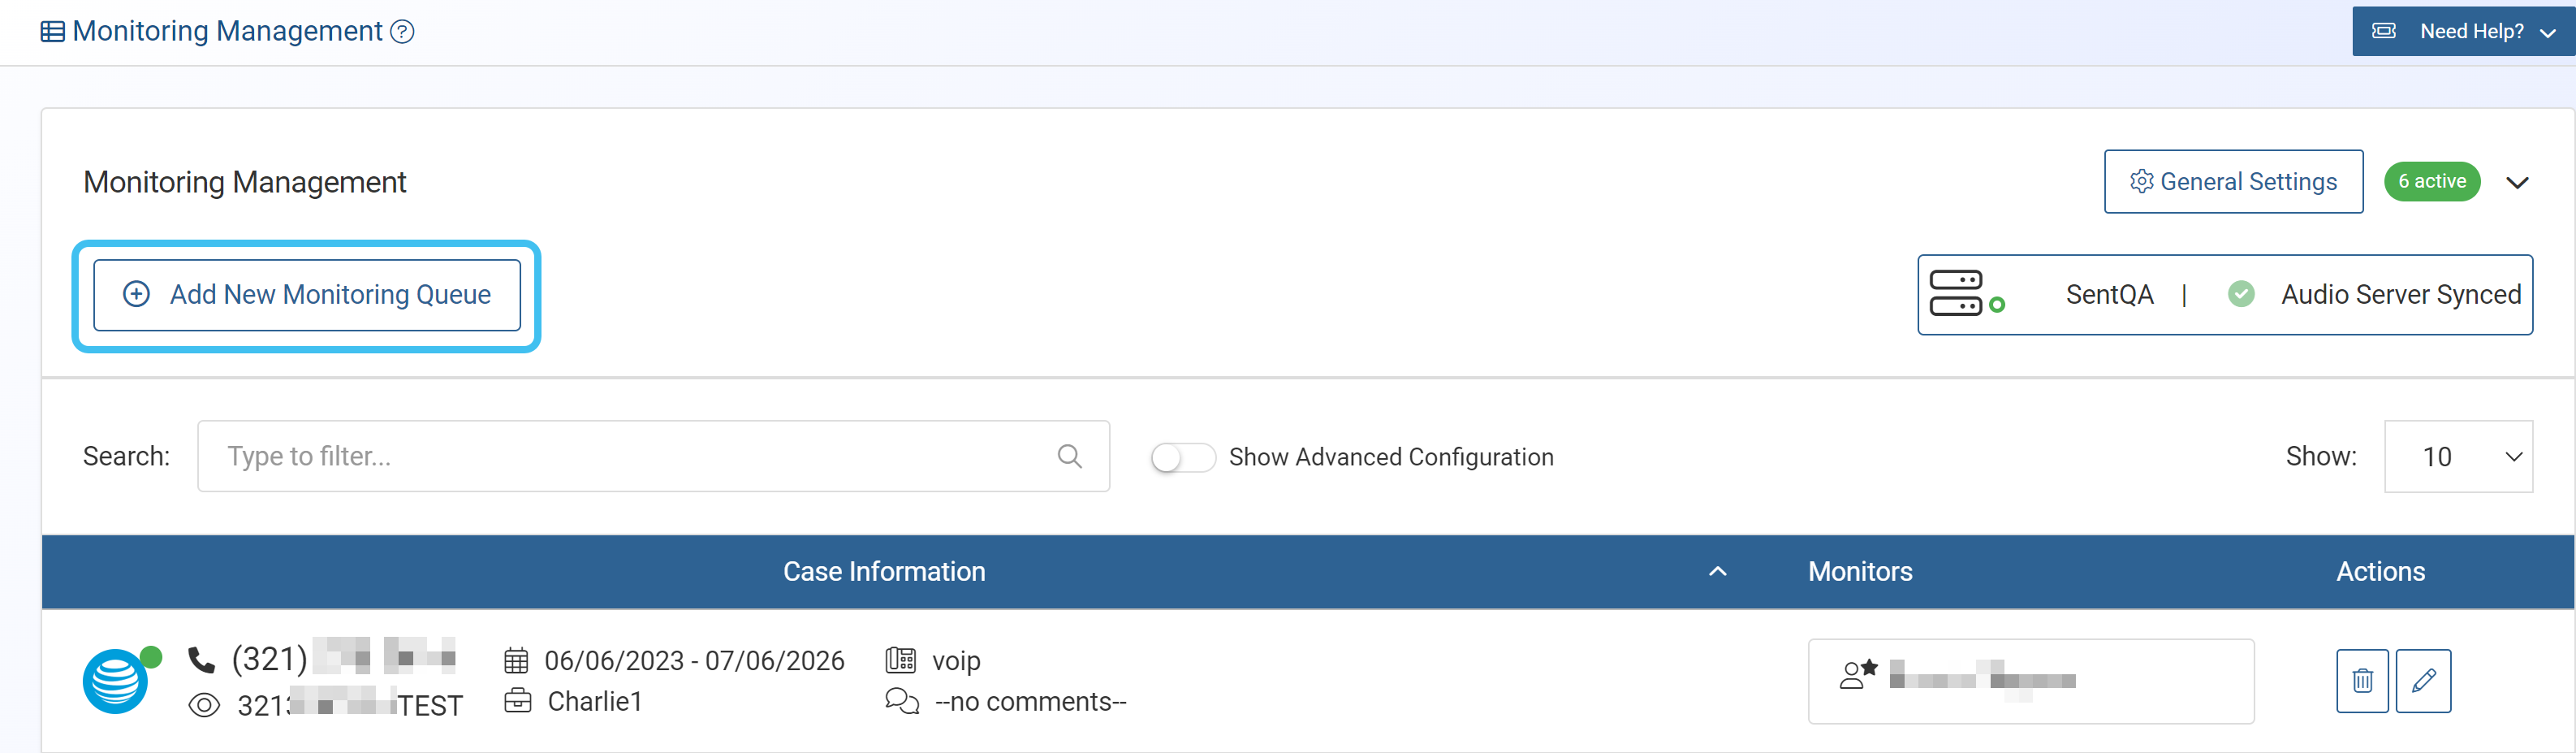
In Monitoring management locate the queue you want to edit the monitoring settings for. You can enter the full or partial case name, phone number or i-case in Search to quickly locate the queue.
Then in the Actions column click .
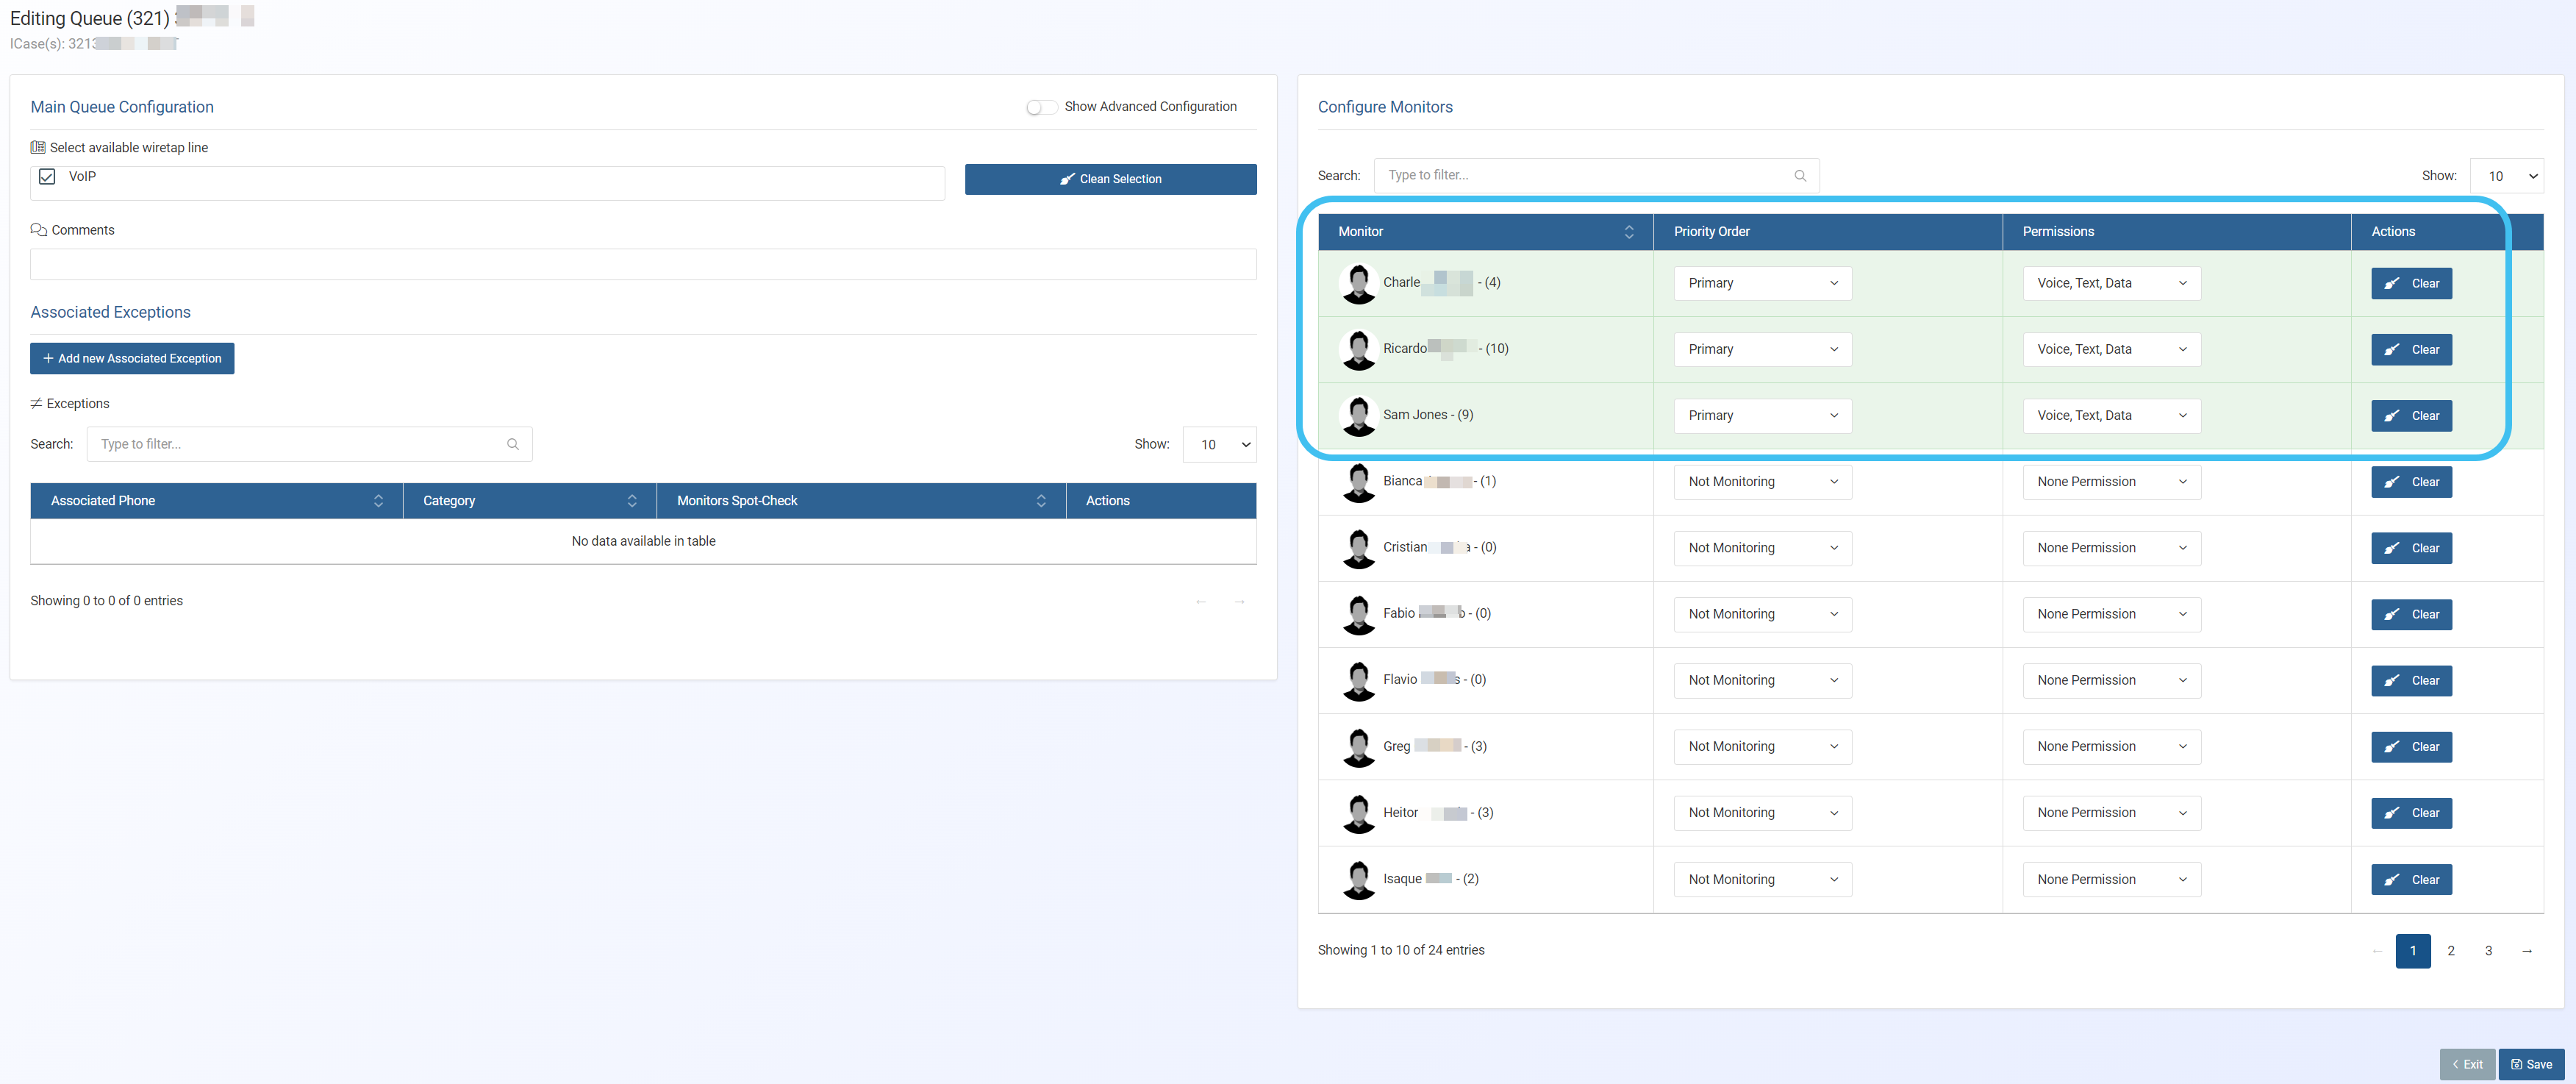
The Editing queue screen opens.
The green highlighted area details which monitors are assigned to the target. To modify, add, or remove a monitor use the drop-down menus in the Priority order column or click Clear. You can enter the monitor's name in Search to quickly locate the monitor you want to add or modify.
If required you can also change other settings for this queue such as the wiretap line, transcript settings, associated exceptions, or the advanced configuration settings. For further information on these settings refer to Create new monitoring queue screen and Editing queue screen.
Click Save.
NOTE: It is not possible to save any changes to a monitoring queue when there is currently a communication on the queue being monitored. You must wait till the communication has ended.
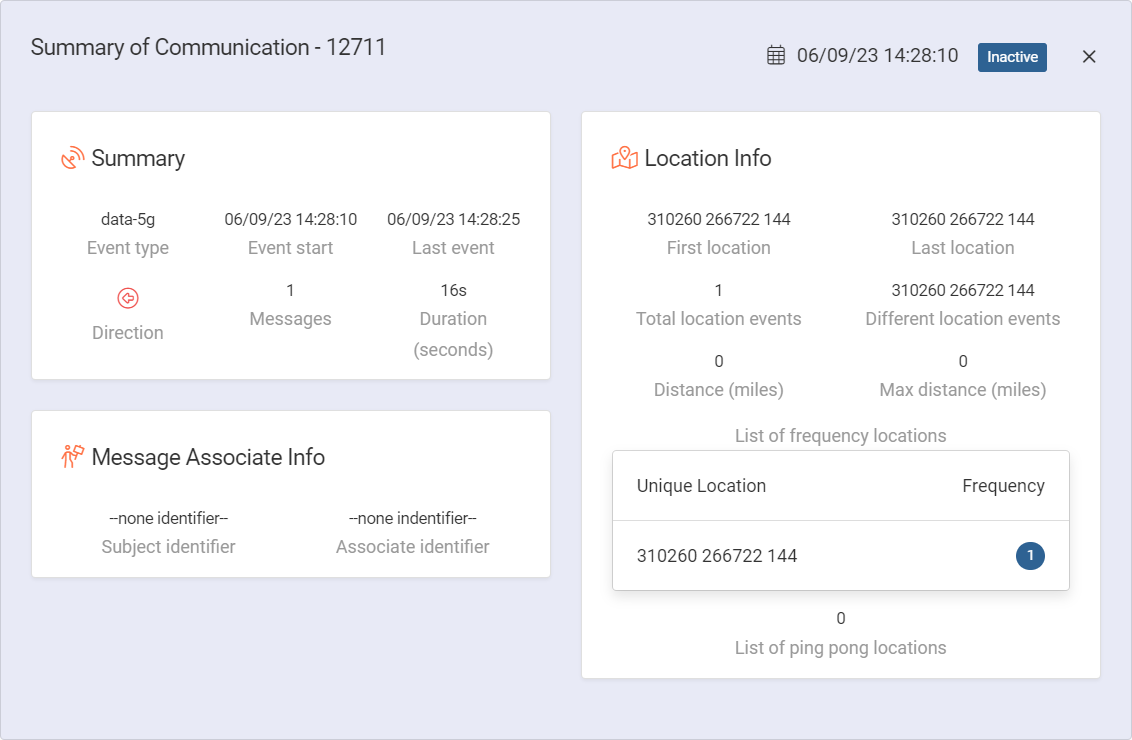
How do I add and edit person details from the Sentinel screen?
Managing person details on Sentinel
This topic explains how to edit a person's details when you are on the Sentinel screen.
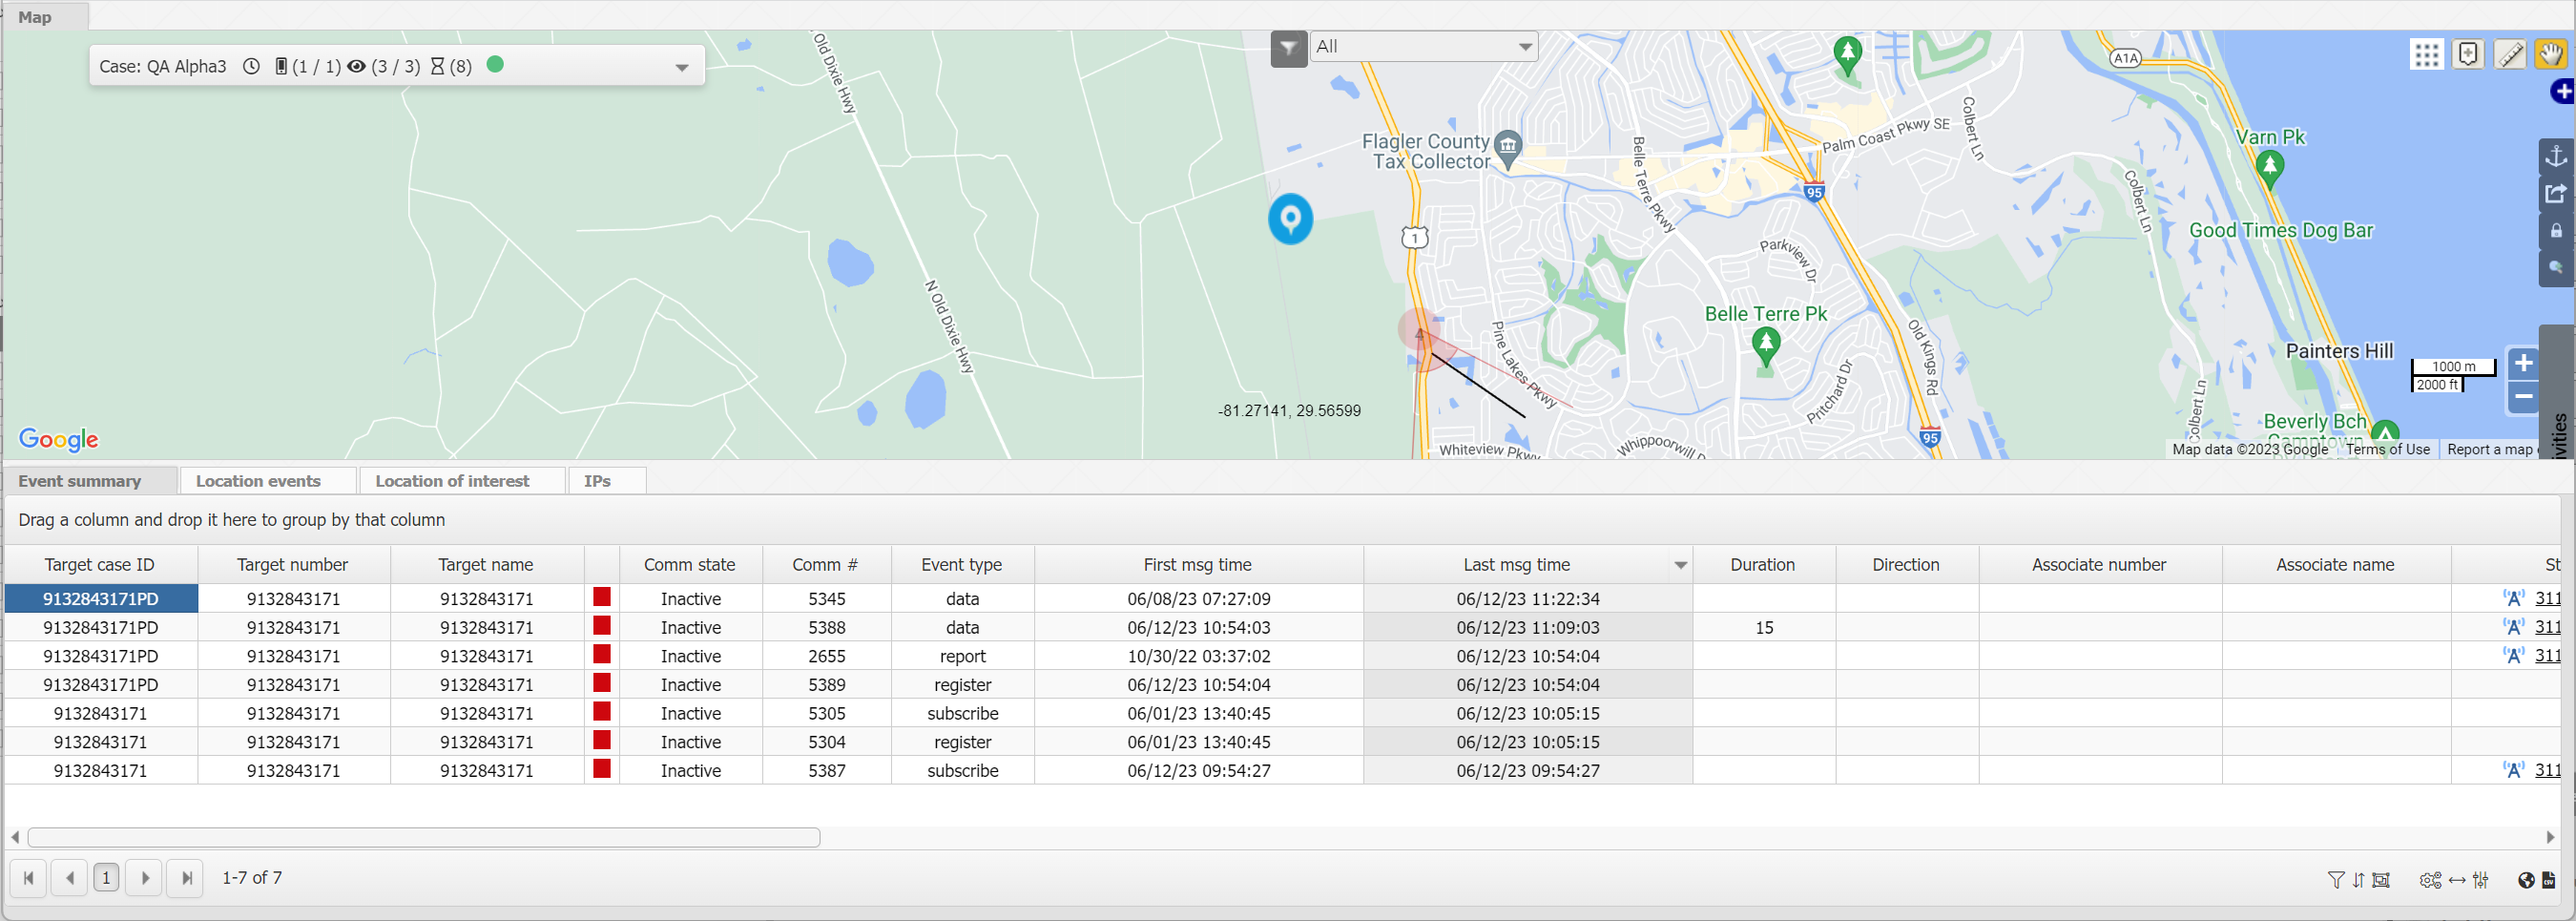
Viewing the Sentinel screen on a secondary monitor is an efficient method of visualizing location information while monitoring PRTT data. If you need to edit a person's details, then use the following procedure.
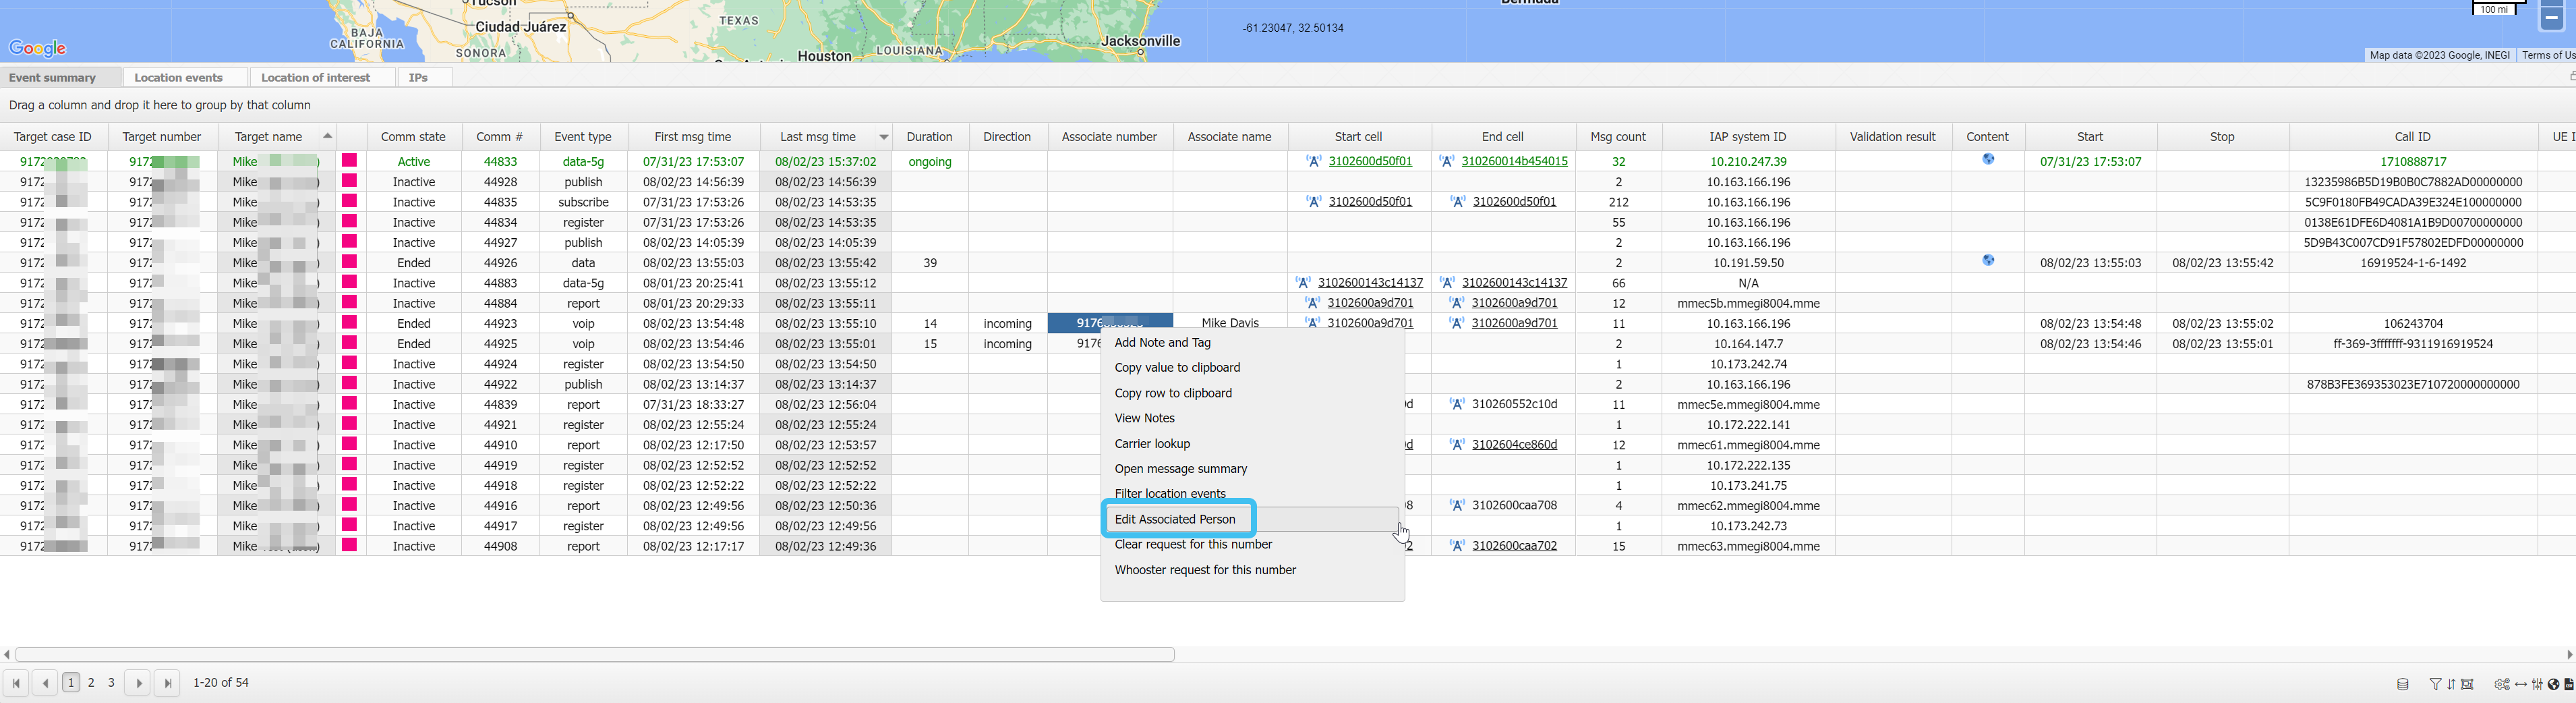
On the Event summary tab, in either the Target number, Target name, Associate number or Associate name column, click their number or name and select Edit person or Edit associated person.
The Edit person screen opens.
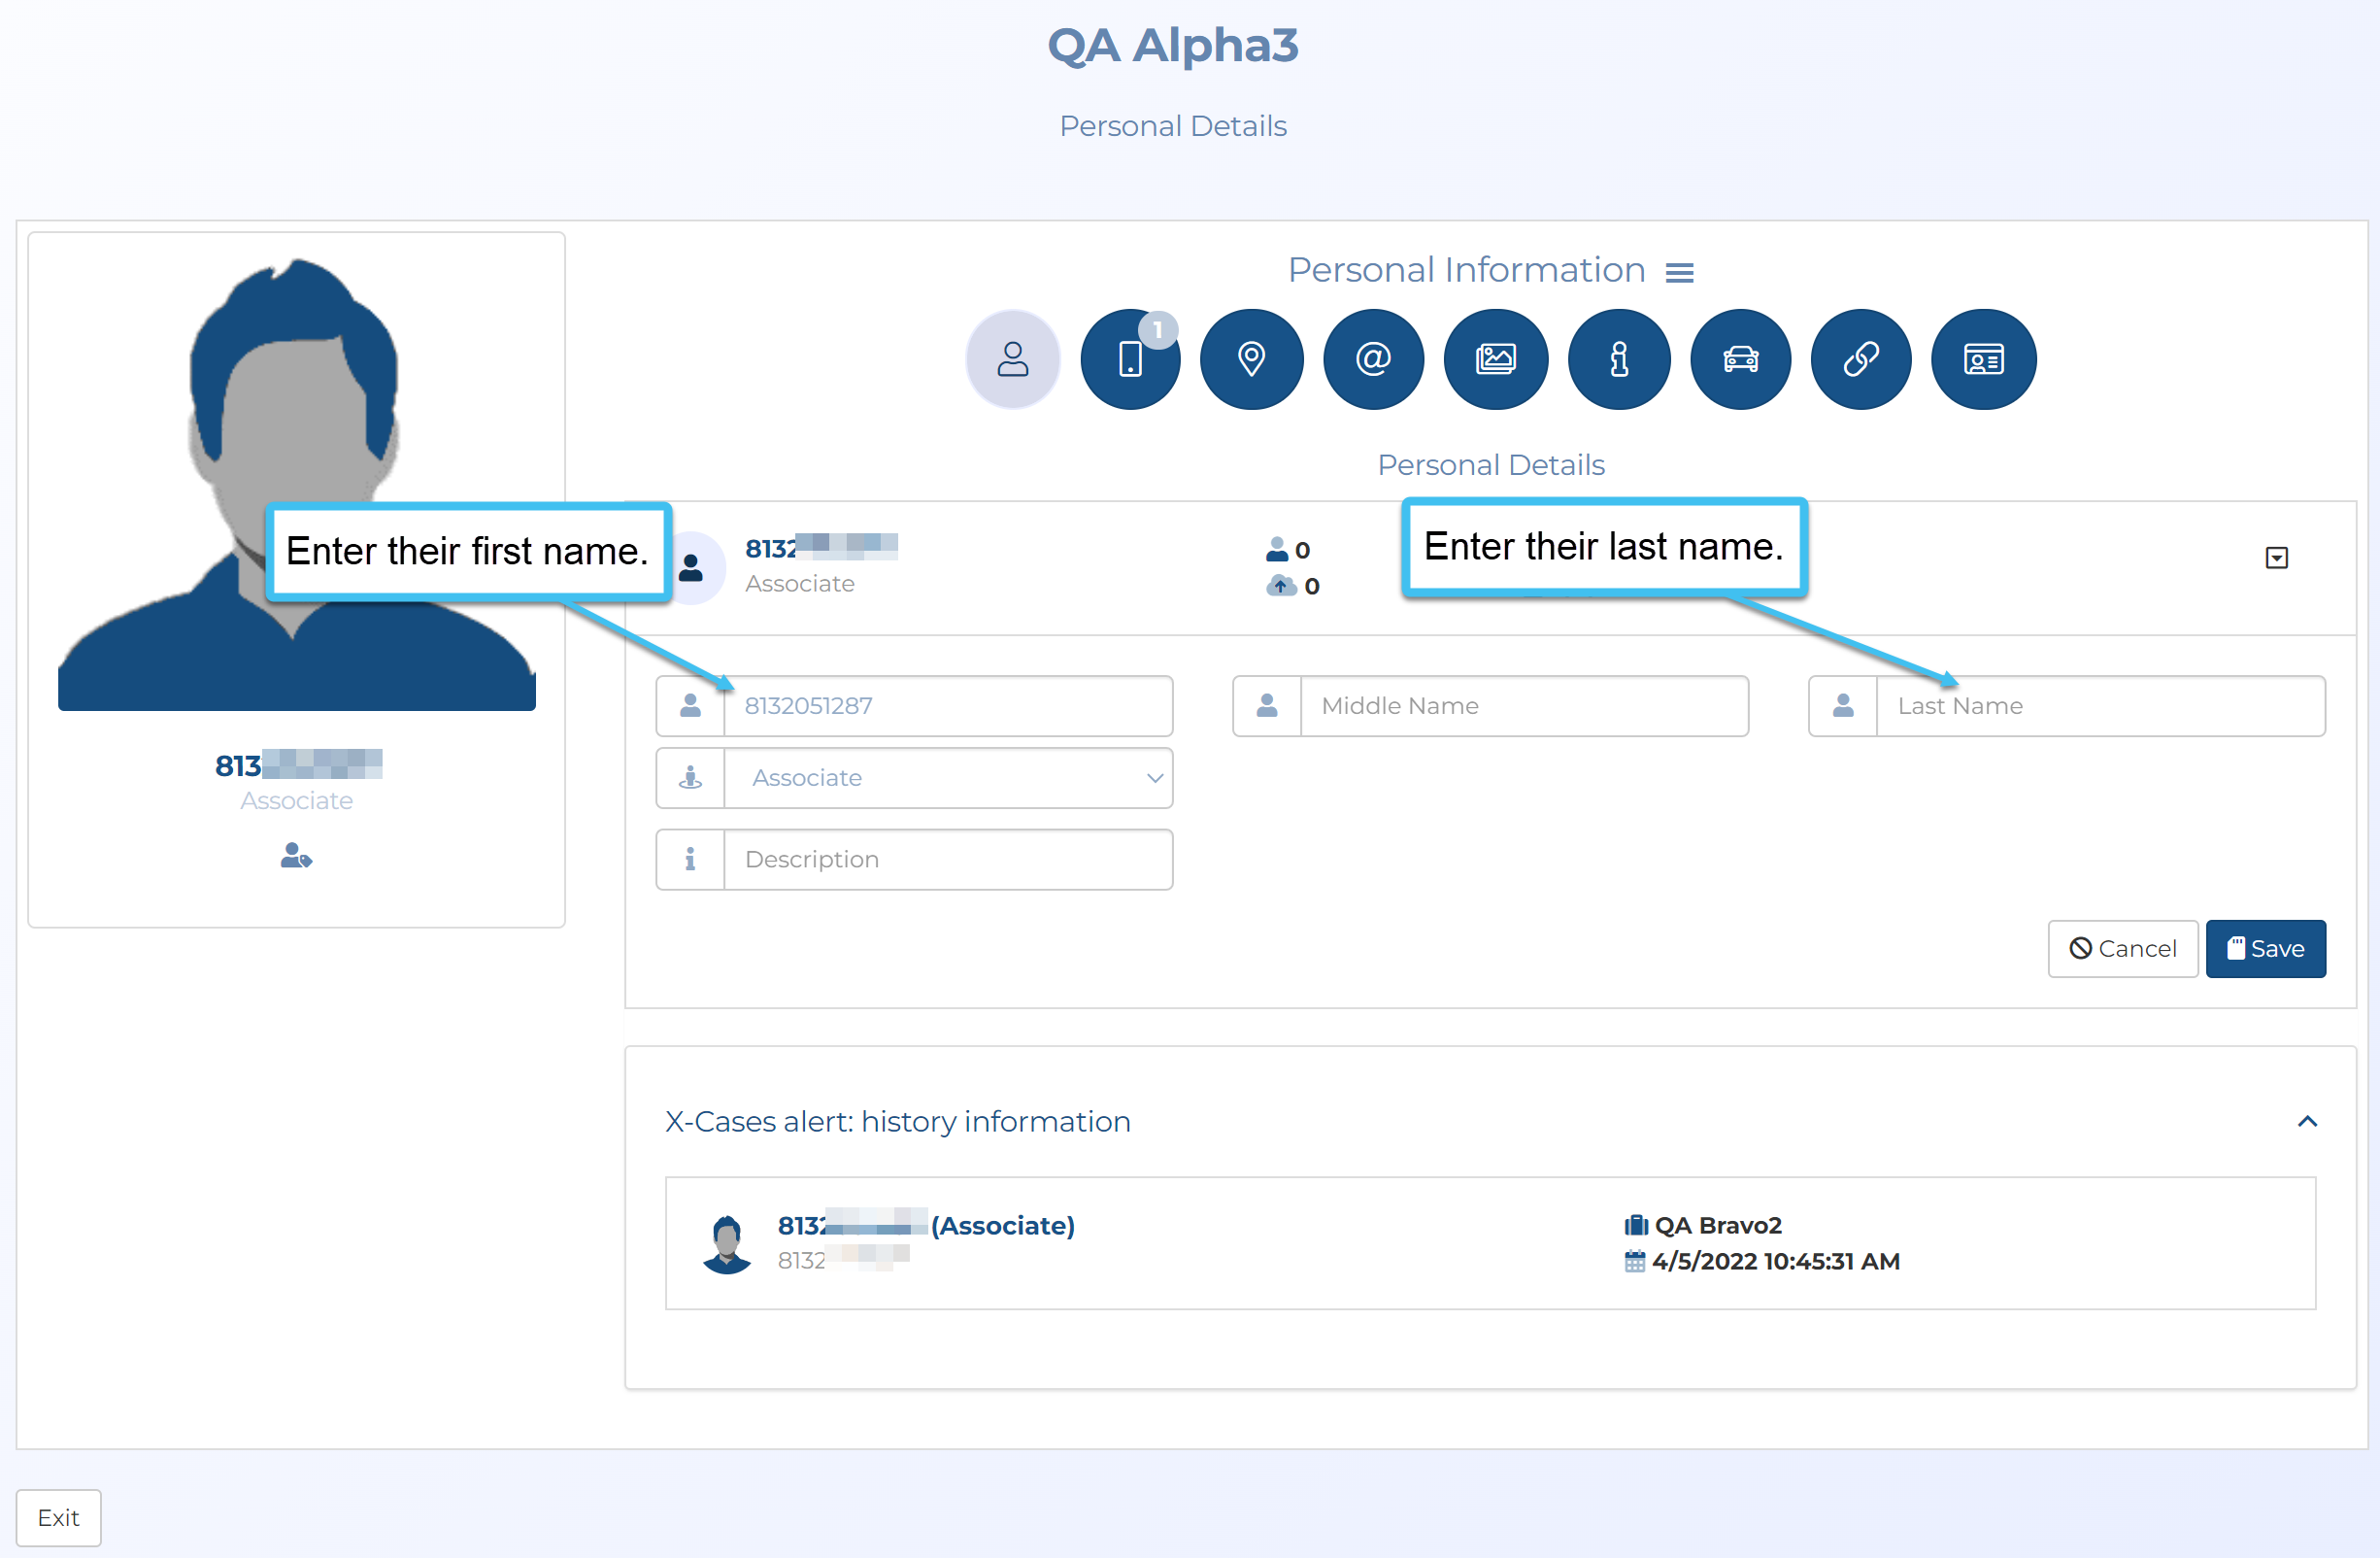
To edit the person's details either click then from the menu select Edit person or click alongside their phone number.
The person's details are displayed.
You can replace their phone number with their first name and enter their last name.
How do I configure a wiretap monitor station account that allows local monitor login?
How to configure a live monitoring (wiretap) station account that allows local monitor login
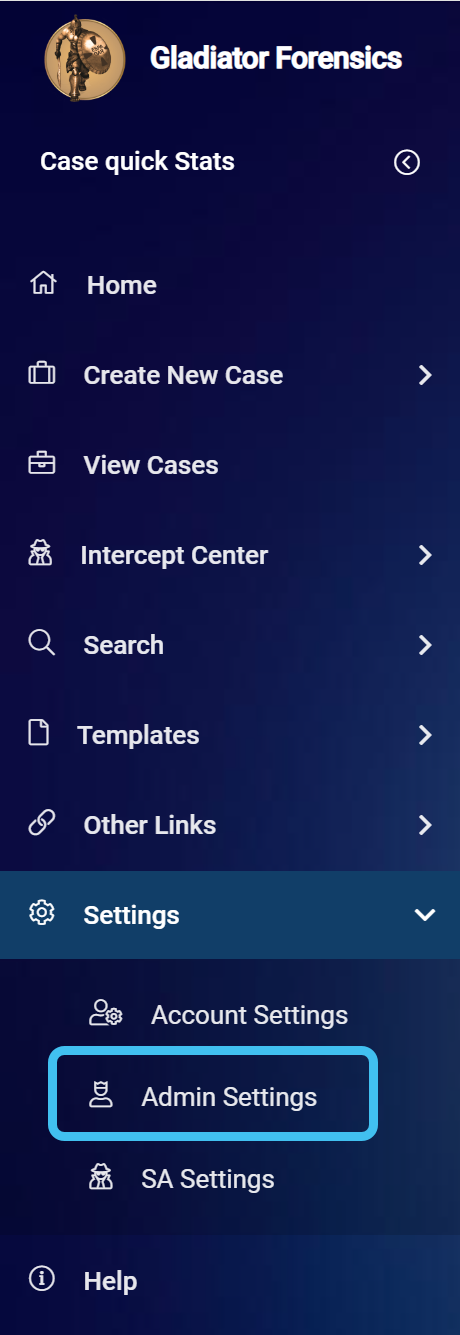
On the main menu click Settings, then click Admin settings.
The Admin settings screen opens.
Click Manage users. The Manage user screen opens.
Click the name of the station you want to configure for Live monitoring, or if you are adding a new station user click Add a new user below the table.
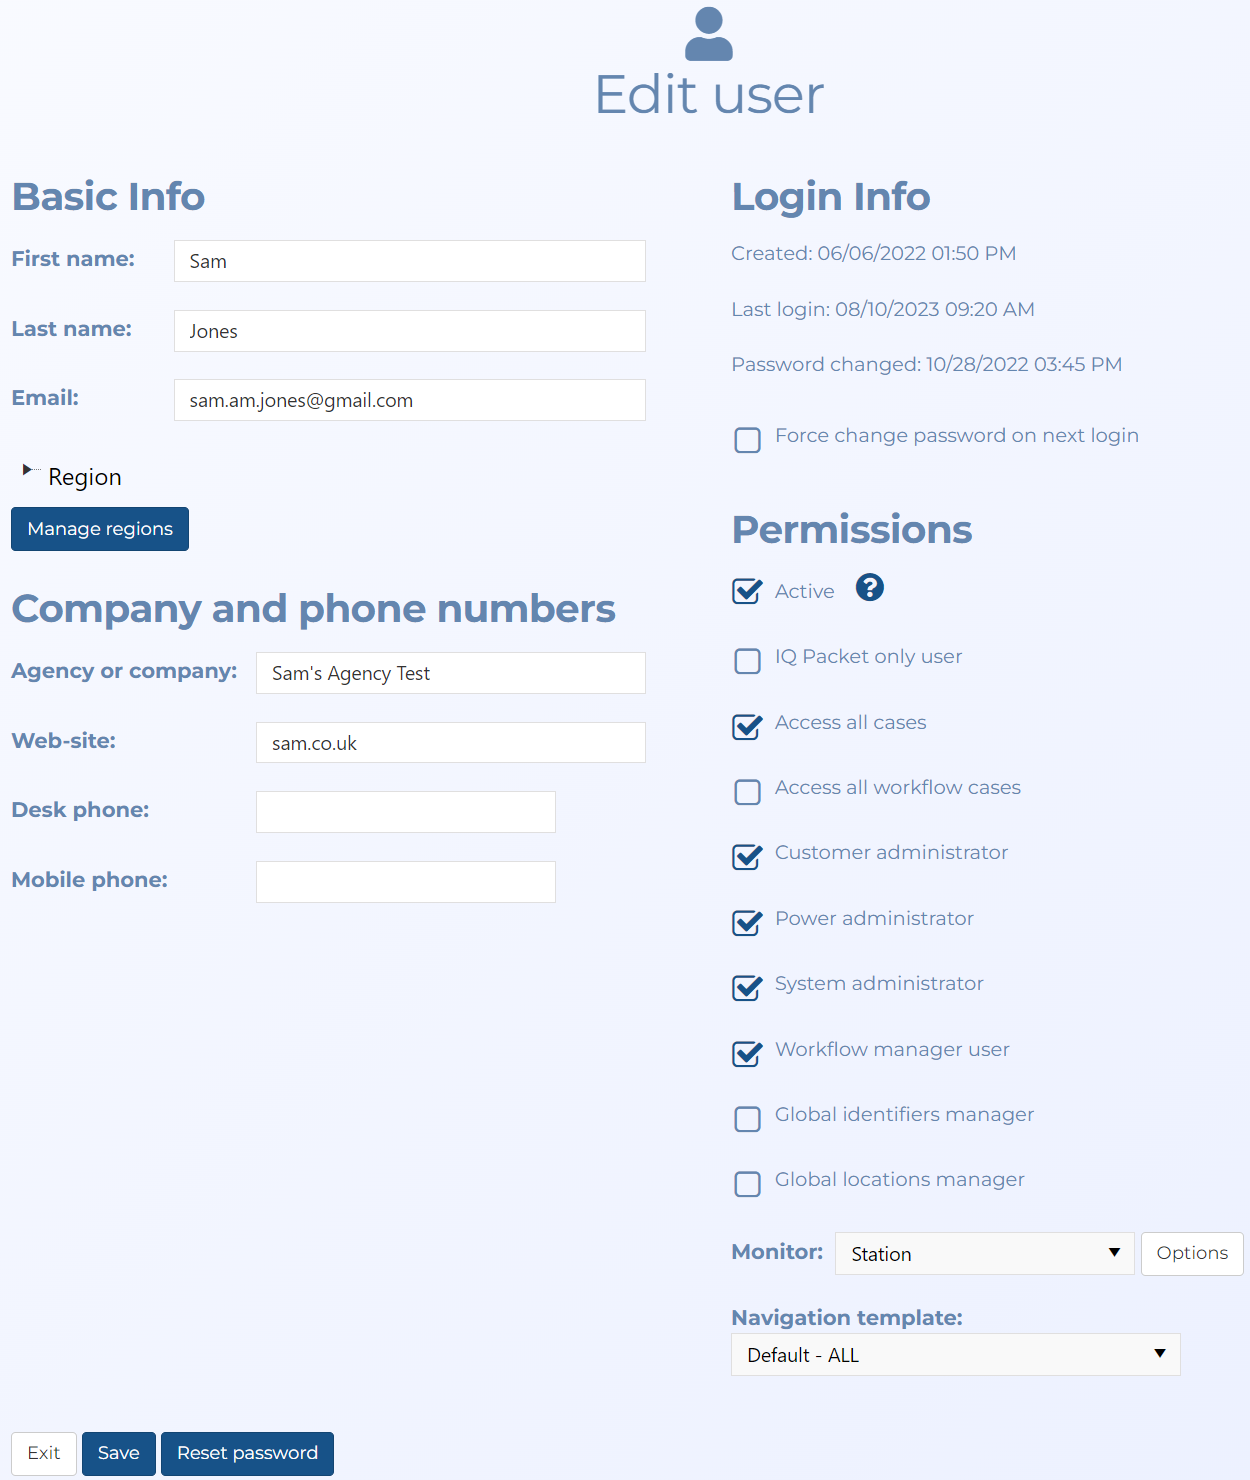
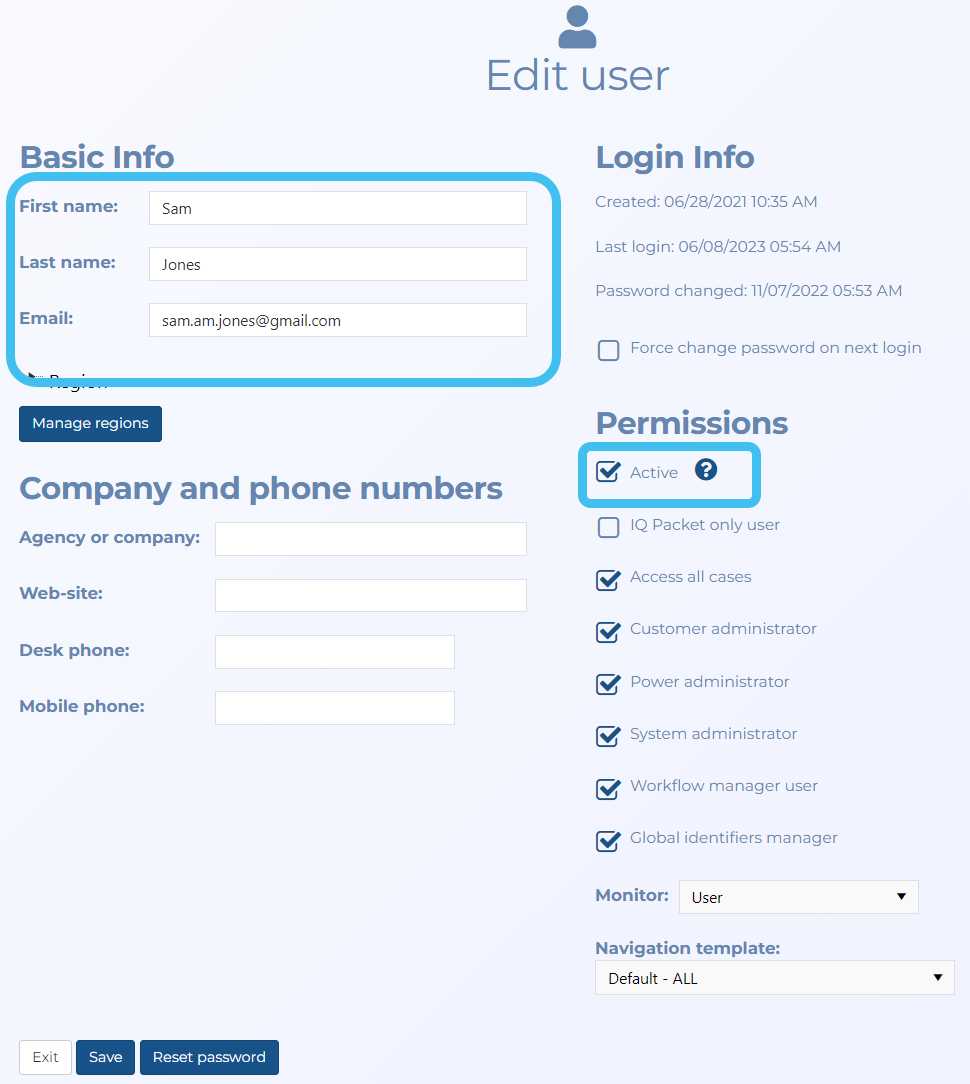
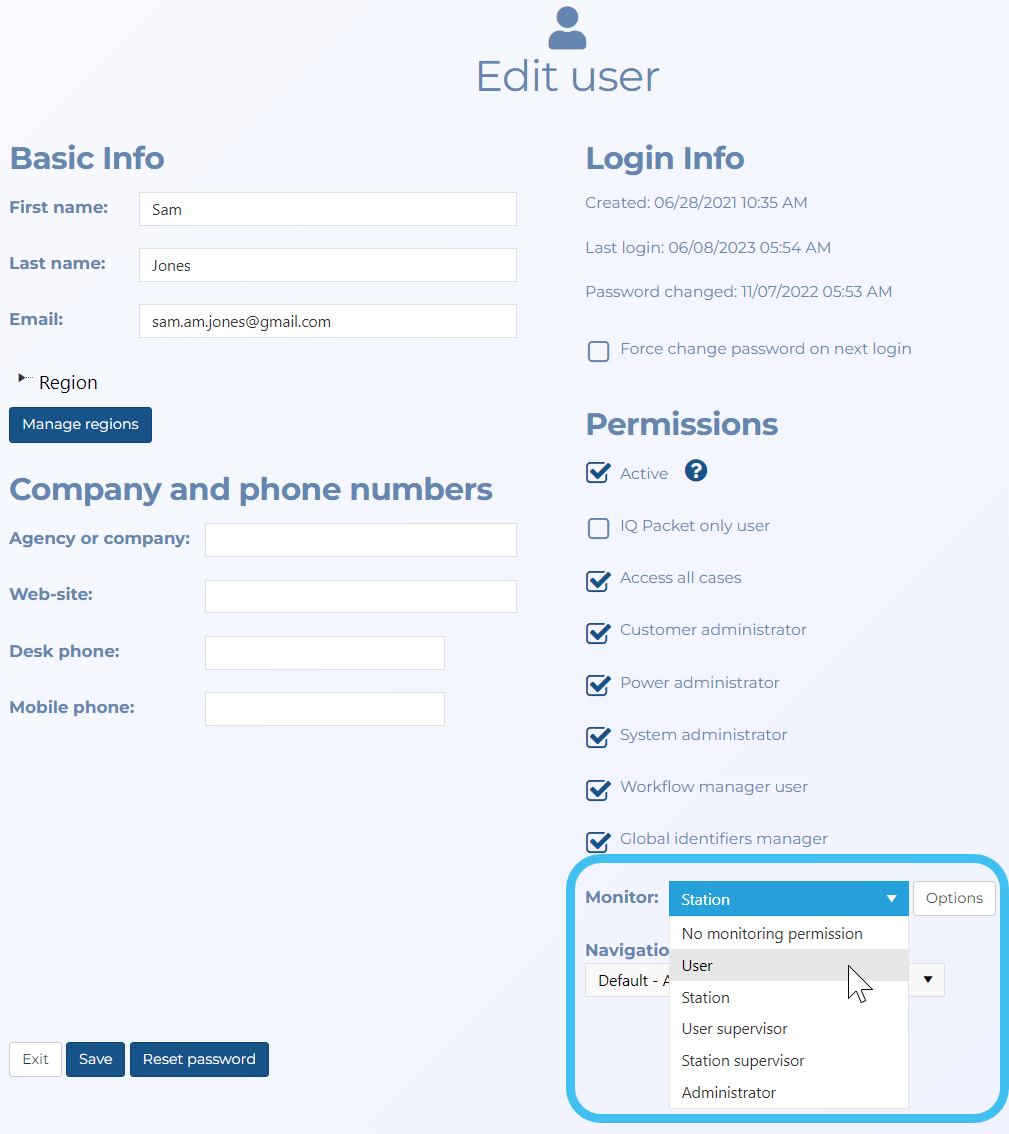
The Edit user screen opens.
If you are adding a new user then complete: First name, Last name and Email and ensure Active is selected. For example, you may want to add a first and last name of "Monitoring Station1" and optionally create an email account.
In Monitor, select Station.
Click Options.
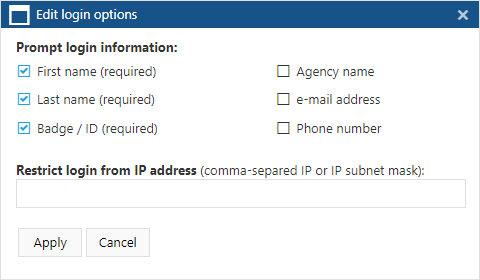
The Edit login options dialog box opens.
In Prompt login information, select which details the station users must enter immediately after they have logged into the station account. These individual user details are then stored by OSS-ESPA in the audit trail so that if required you can trace who was monitoring the subject at any point in time and any actions that they too.
In Restrict login from IP address, you can enter optional IP data if you want to restrict the access of the station account.
This topic describes how to create and configure a monitoring queue for the target's voice, data and text. To creating a monitoring queue for their social media refer to How to create a monitoring queue for social media.
You can either assign individual users to a queue or you can assign monitoring stations to a queue. Assigning monitoring stations simplifies the administrative process of configuring the multiple different users who are monitoring the subject throughout the period of the warrant. You must first add a user account for the station, as you would for a normal user, for example you may want to add one with the first and last names being "Monitoring Station1". For further information refer to Setting up a person or a station for live monitoring.
On the main menu click Intercept Center, then click Queue management.
The Queue management screen opens.
In Monitoring management click .
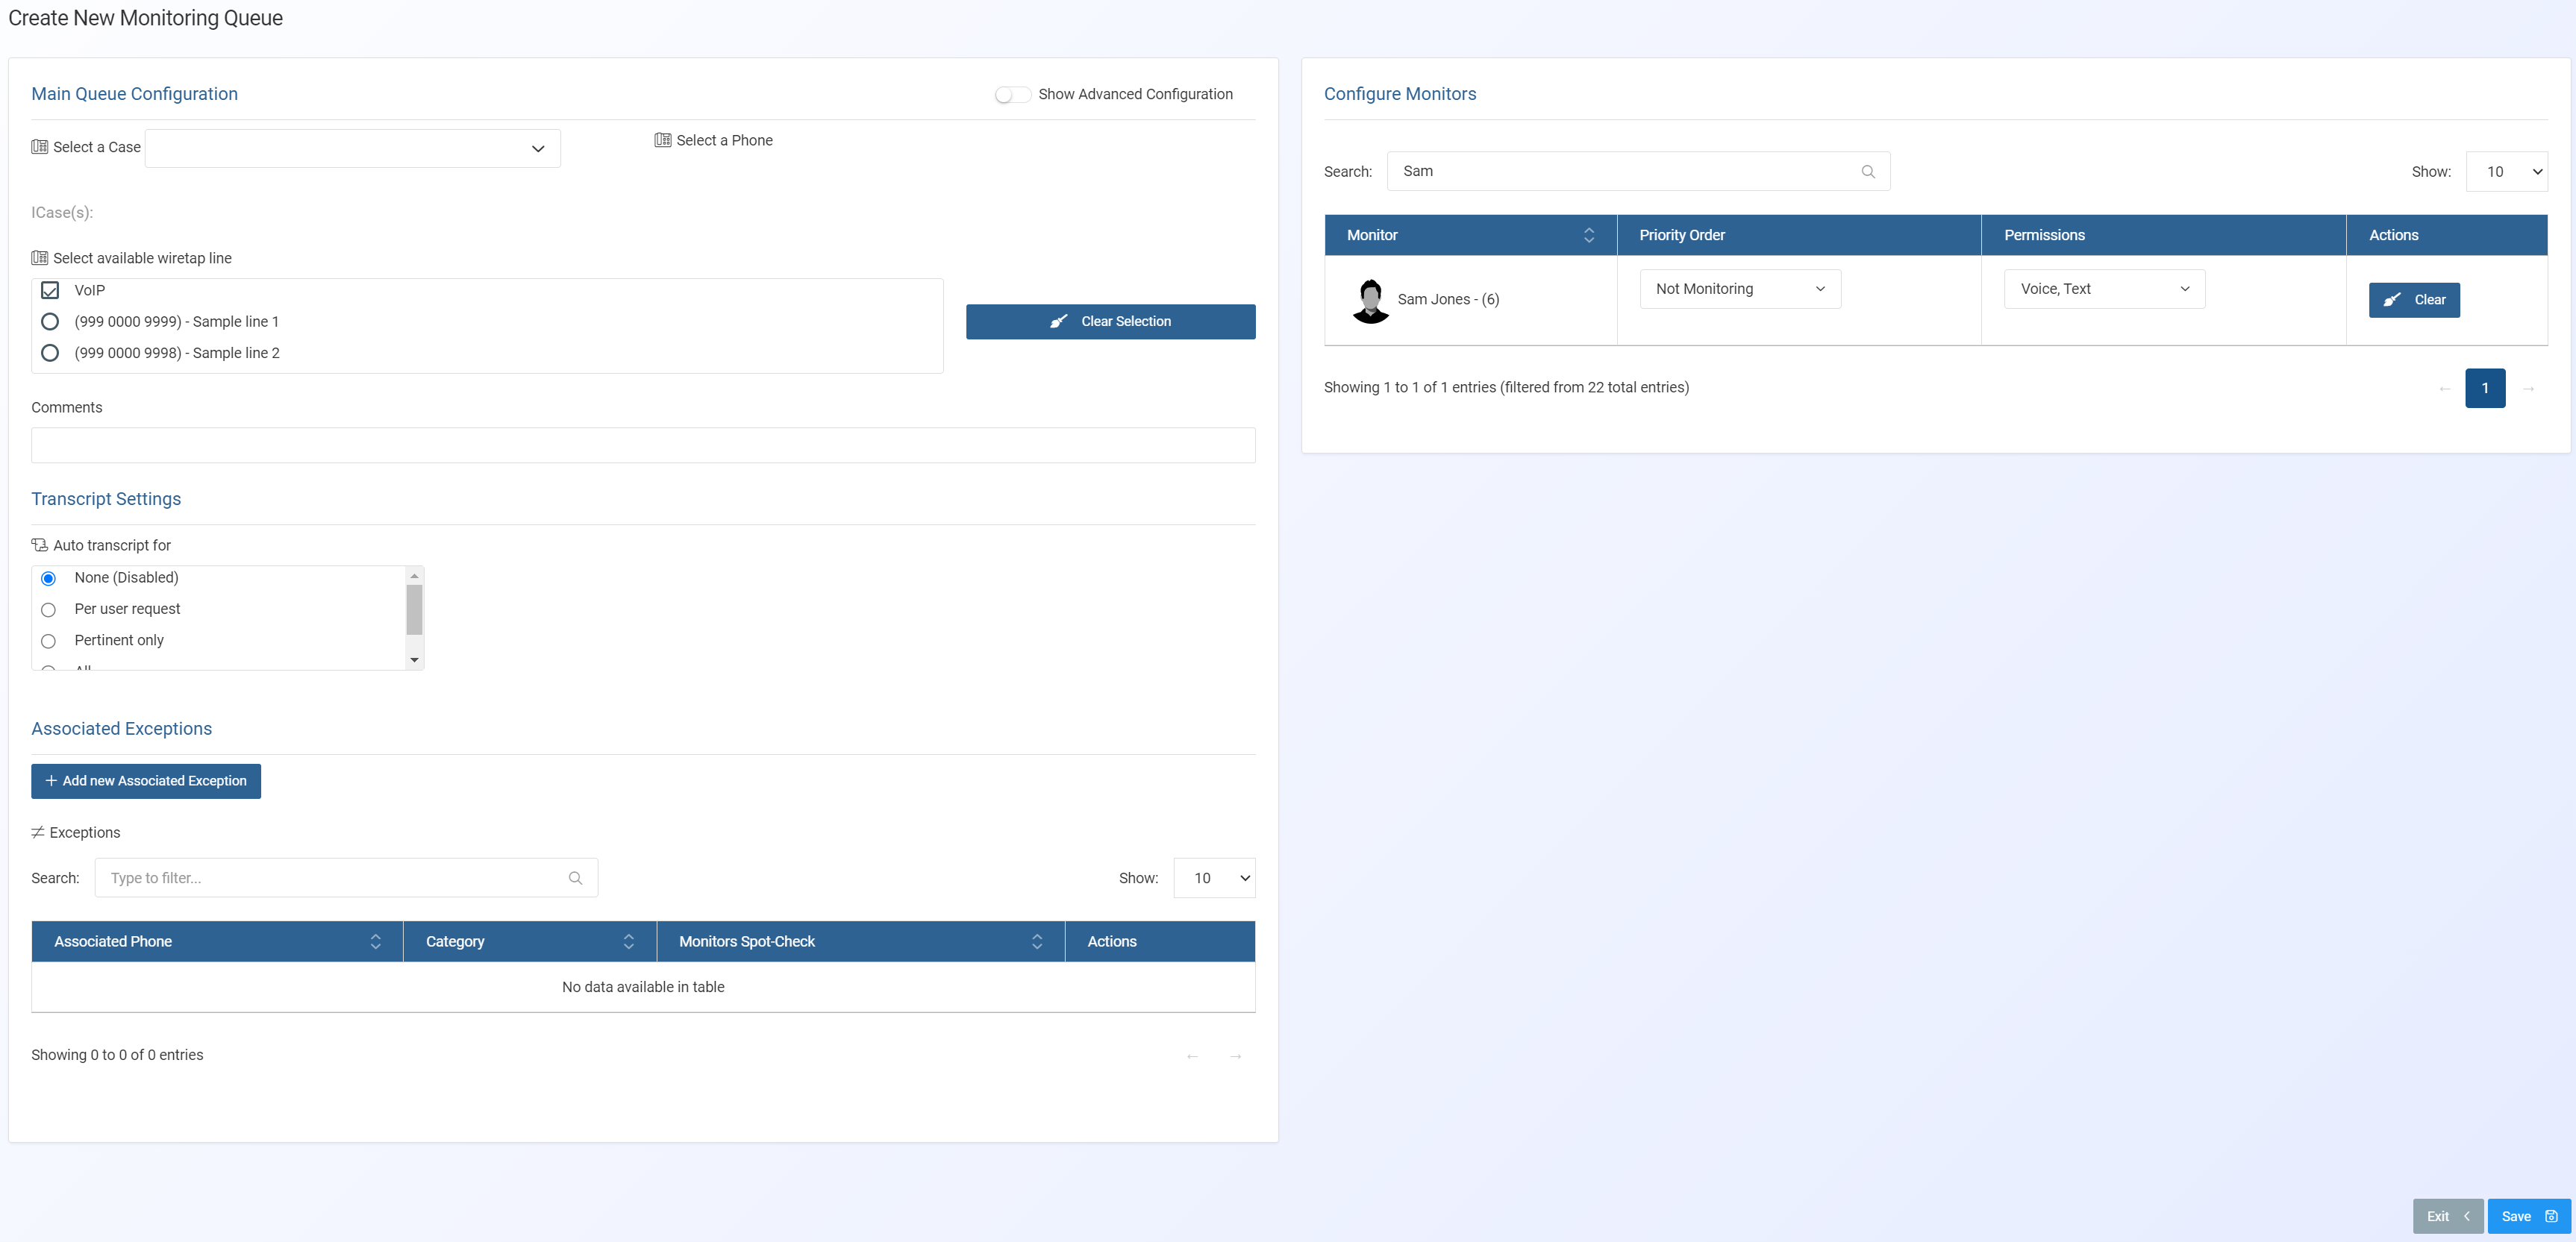
The Create new monitoring queue screen opens.
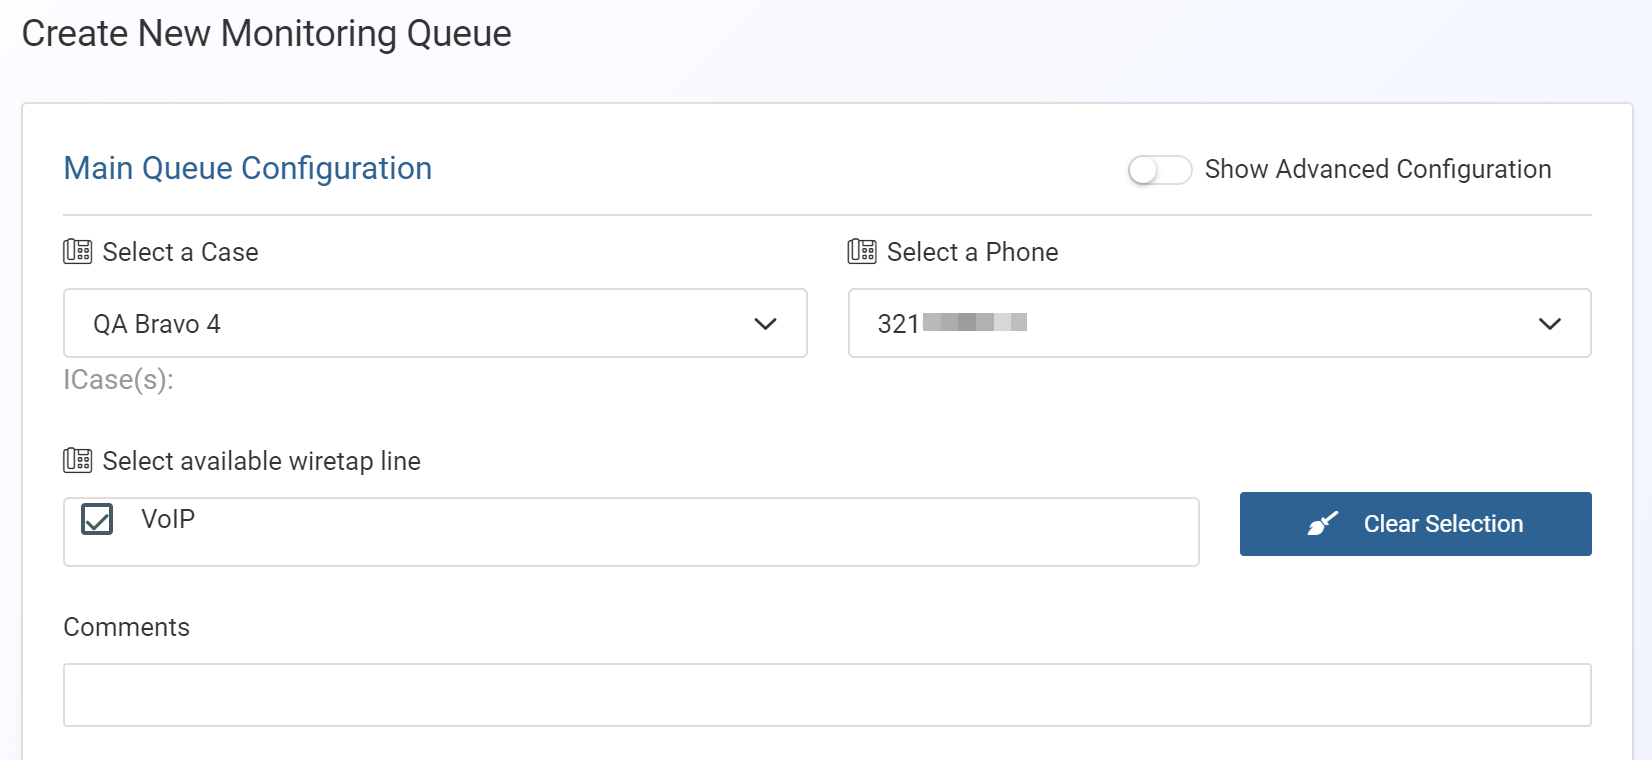
In Main queue configuration:
In Select a case, for the case you want to configure the monitors and wiretap line for, enter all or part of the case name then select it from the menu.
In Select a phone, from the menu, select the phone you want to configure the monitors and wiretap line for.
In Select available wiretap line select through which telephone line you want the call to be delivered.
If required, in Comments enter any text that will help you identify this configuration on the Queue management screen.
In Transcript settings, select the method you want used for the auto transcription of calls once the call has ended.
None (Disabled): no calls on the monitoring queue can be auto transcribed. This is the default setting.
Per user request: this provides an auto transcript button on the Transcript dialog box which allows the monitor to decide which calls are auto transcribed. This is the most commonly used setting. Note, if the monitor enters a transcription manually then it is no longer possible to request an auto transcription and the auto transcript button does not display.
Pertinent only: when the call category is set to pertinent then a transcription is automatically created.
All: transcriptions of all calls, including unattended calls, are automatically created. This setting is not commonly used due to the large number of calls, most of which do not contain pertinent information.
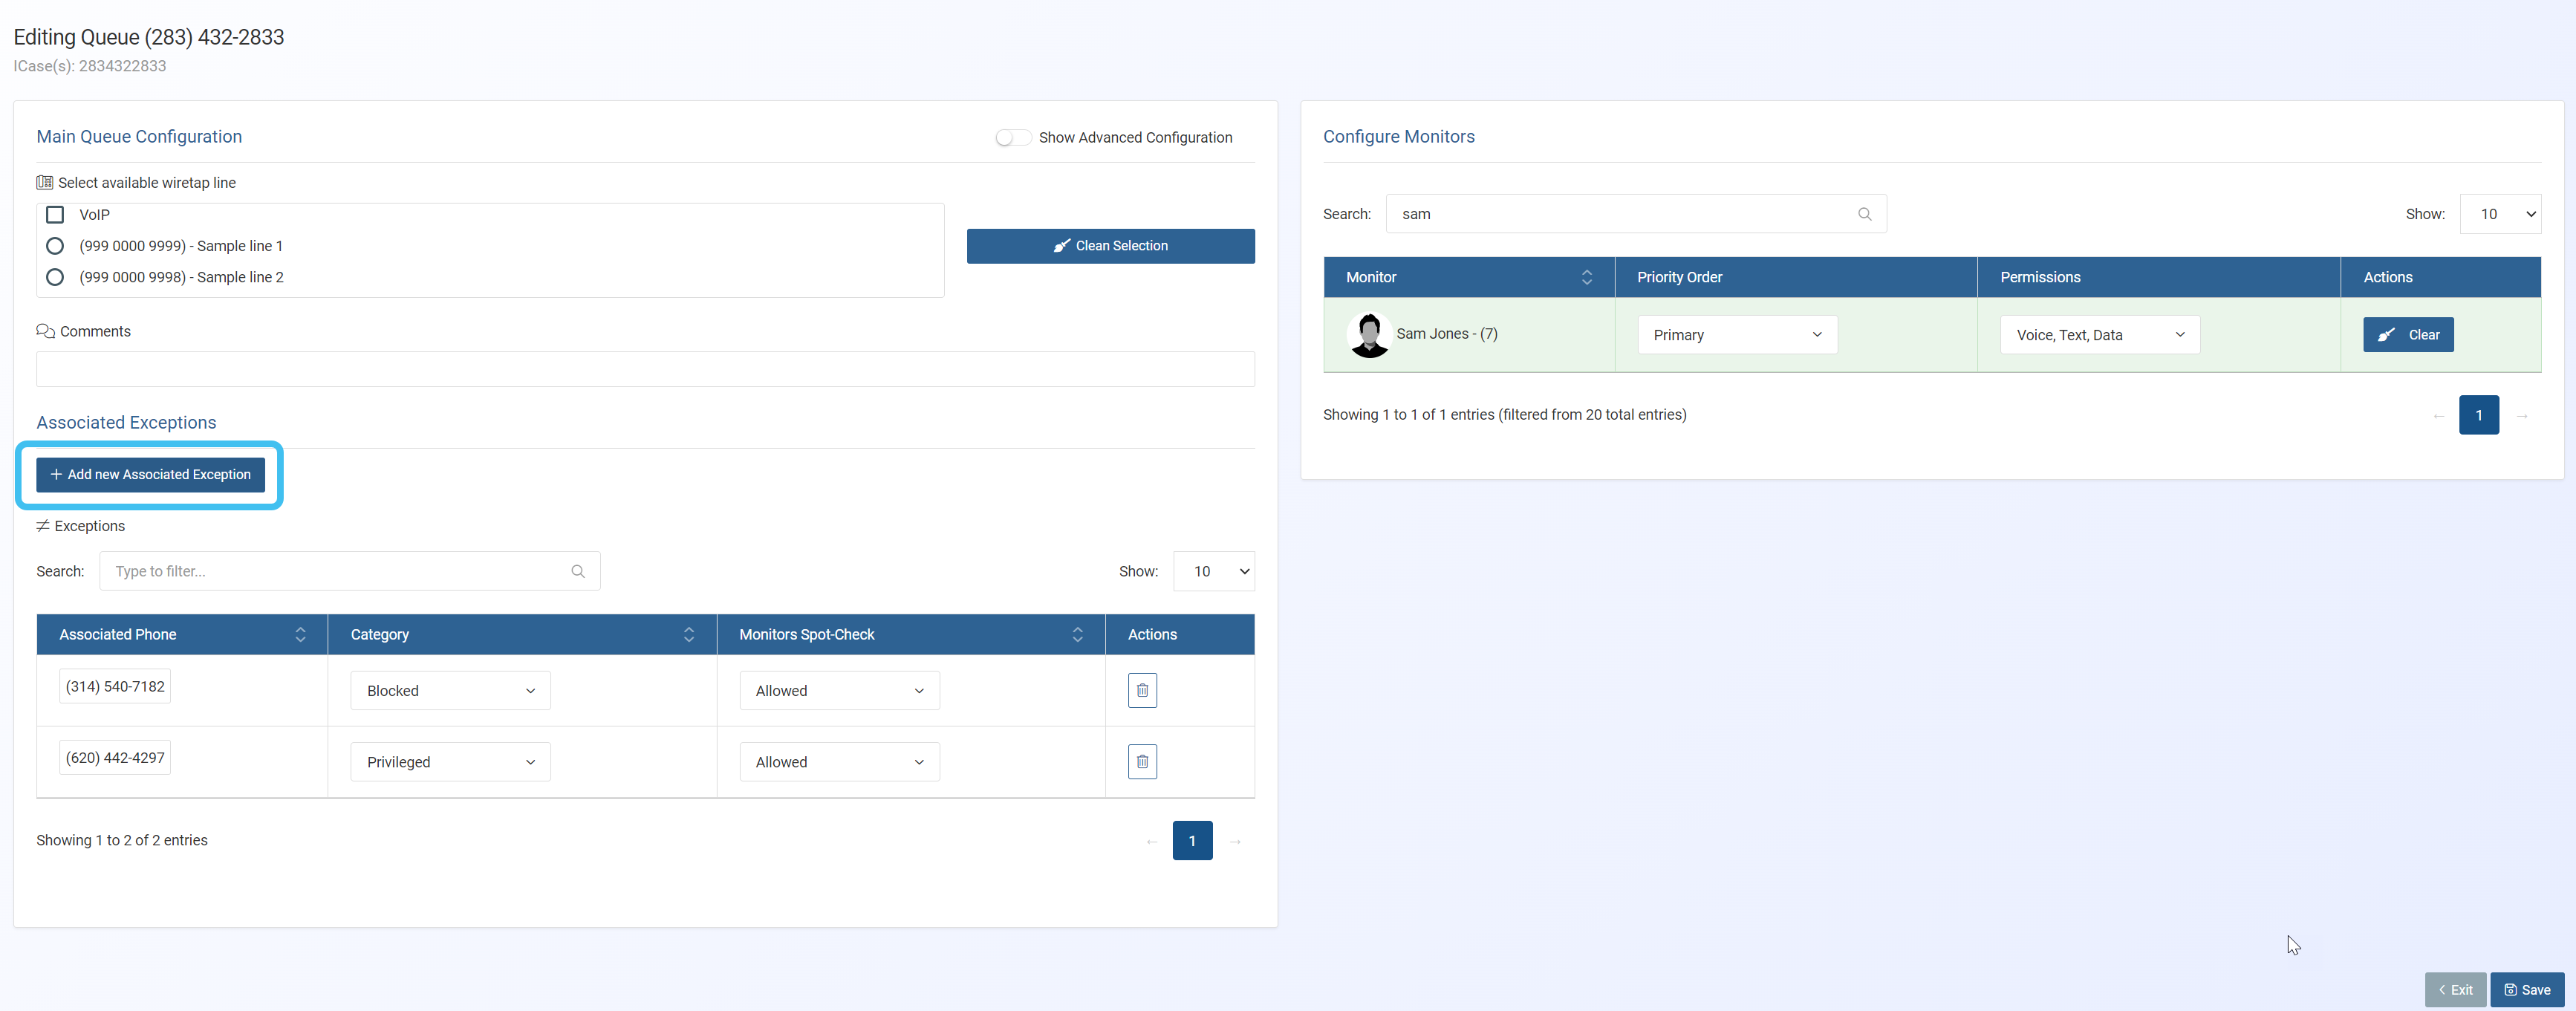
Associated exceptions allow you to define how certain associate phones numbers are handled by Live monitoring. This can be useful for example with the target's lawyer's phone number. To add one:
Click Add new Associated Exception.
In Associate Phone enter the phone number.
In Category select from the menu the category you want the phone to automatically be characterized with. The only difference between Blocked and Privileged is that when a monitor is logged into the queue, with Blocked the call is recorded but with Privileged the call is minimized. For further information refer to Category.
Use Monitor can spot-check to select whether or not you want to allow the monitor to occasionally listen into the call. For further information refer to Monitor can spot-check.
Click Add in Exceptions List.
Your exception is then added to the table where you can edit or delete it if required.
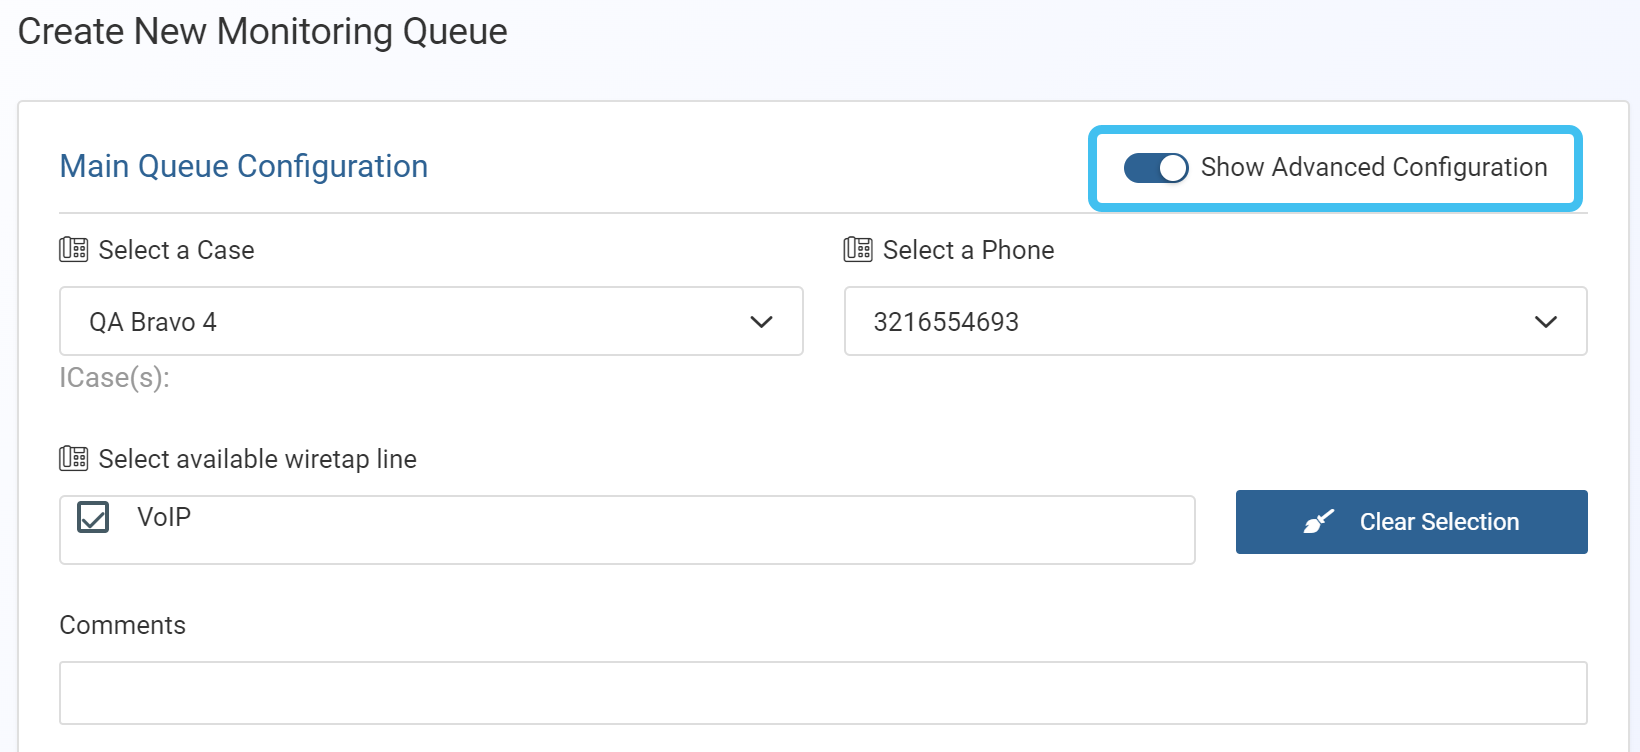
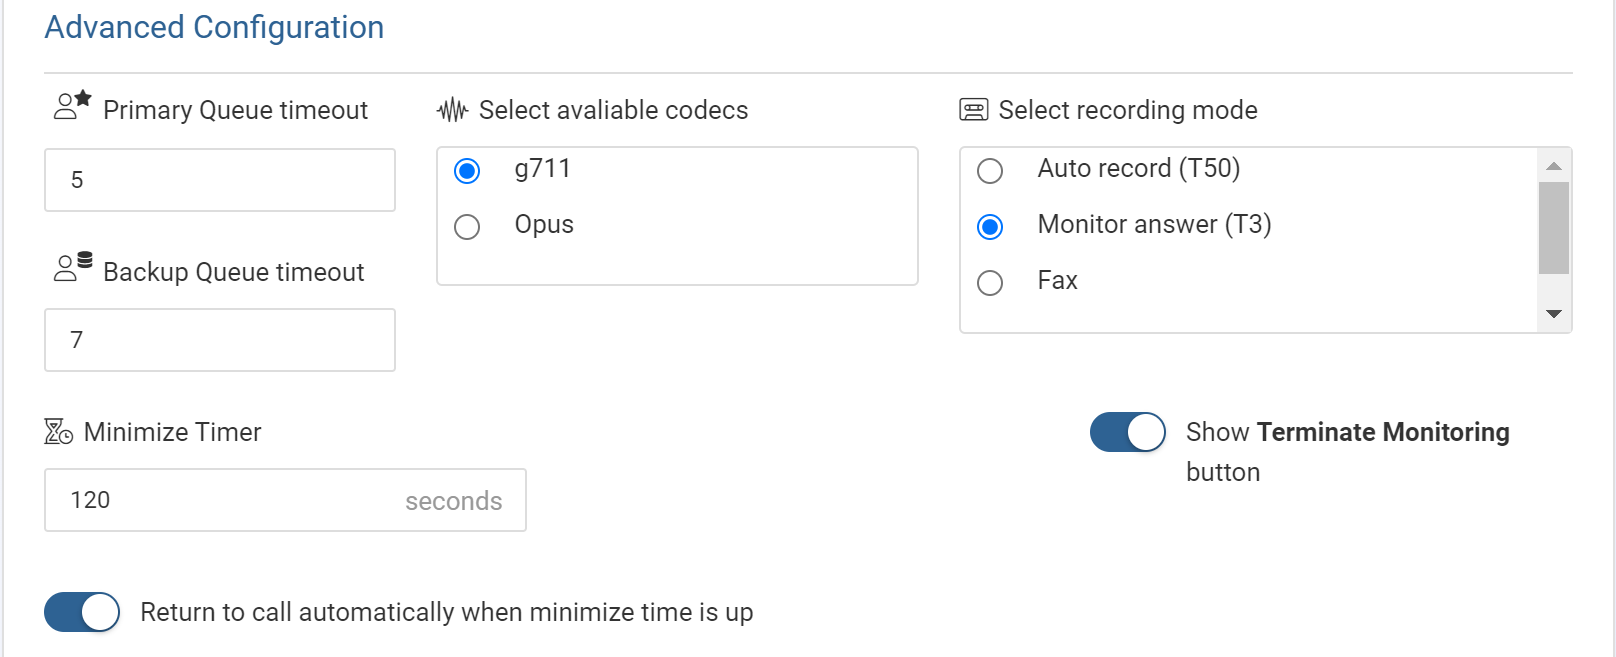
This step is typically not required but if you want to change any of the default settings then click Show Advanced Configuration.
Edit the timeouts, codec, recording mode, minimizer timer, the terminate monitoring button and the SMS/MMS mandatory categorization as required.
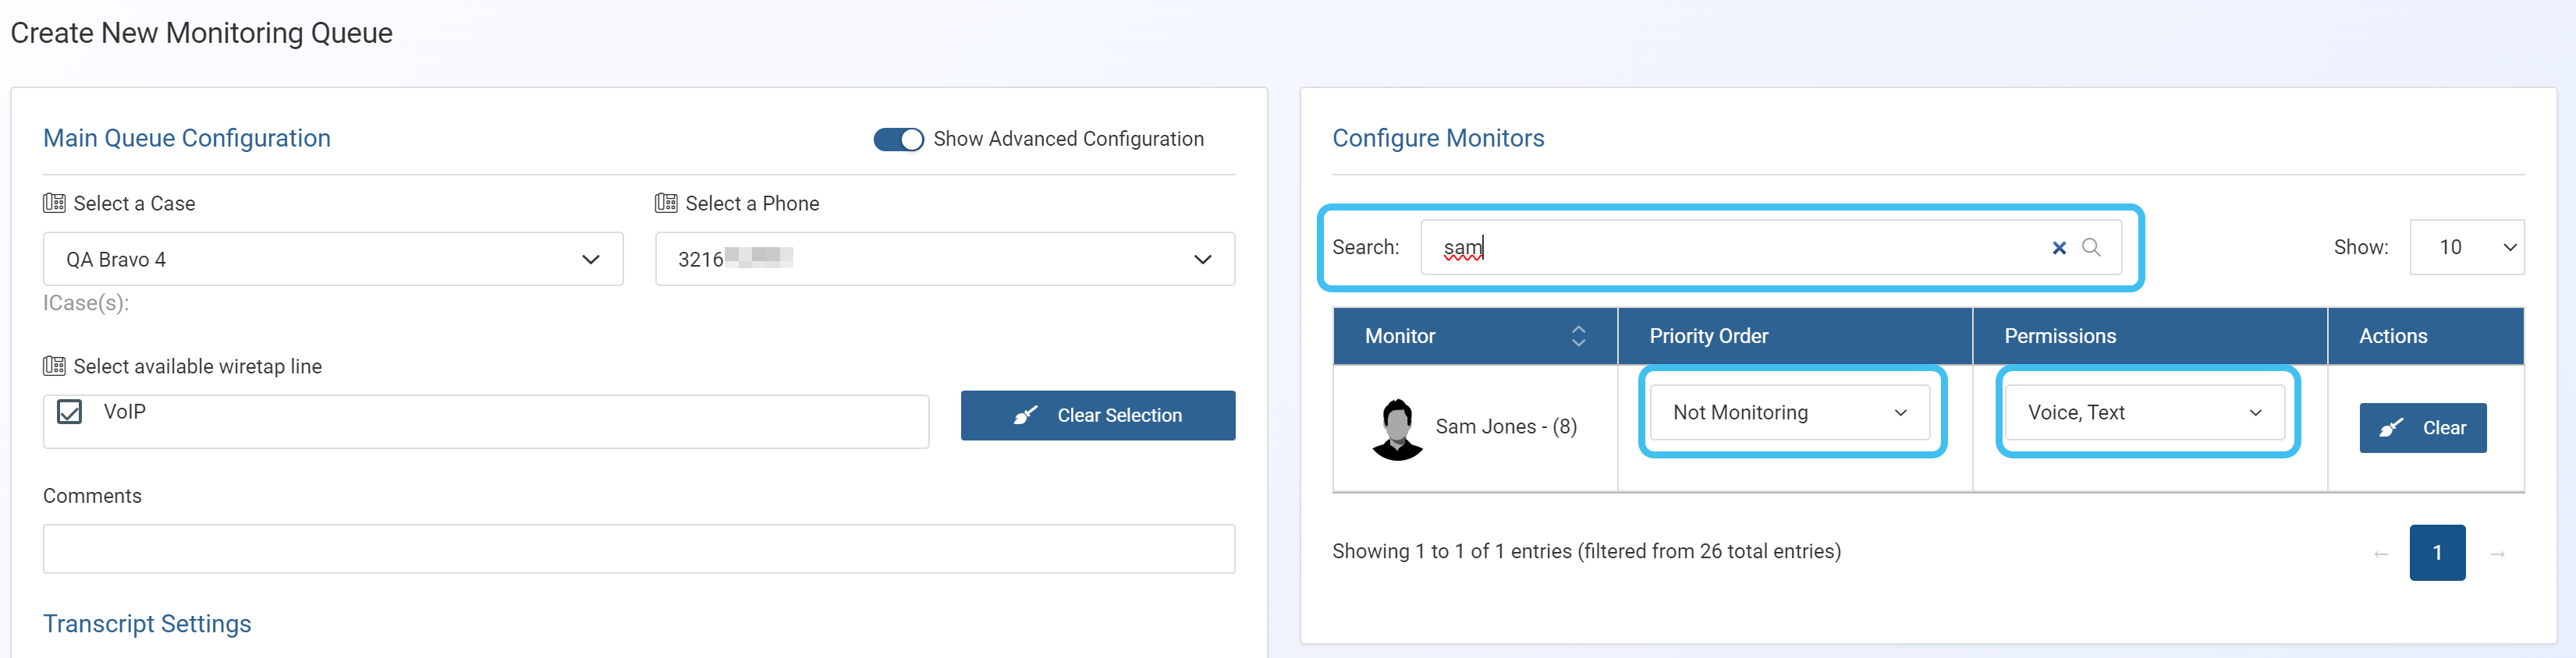
In Configure monitors:
In Search, depending on whether you are setting up an individual user or a station, enter either the name of the monitor or the name of the station. The names that are available to select are those who have been set up to monitor as a User or as a Station by your administrator.
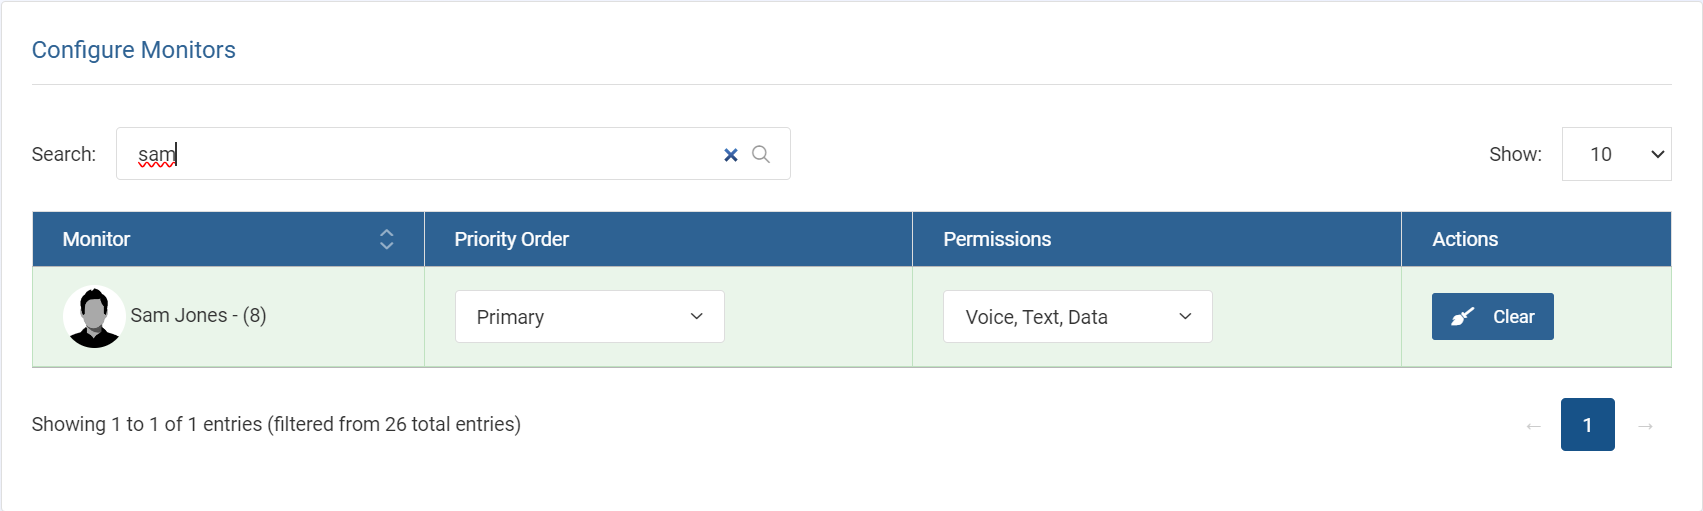
In Priority order select whether the monitor is a primary or backup monitor. It is recommended that you configure two monitors, one for each order.
In Permissions select which content: voice, data and text, you want monitored. The only options that are available are those that you are legally authorized to monitor.
Once a monitor is added to the queue their name is highlighted in green.
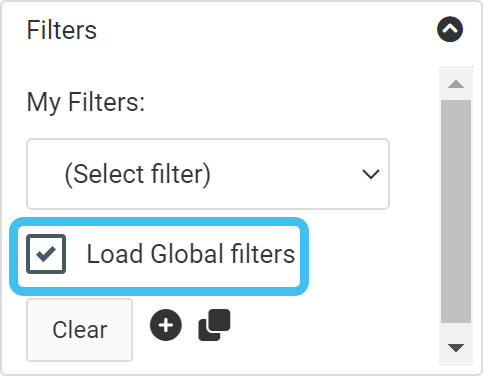
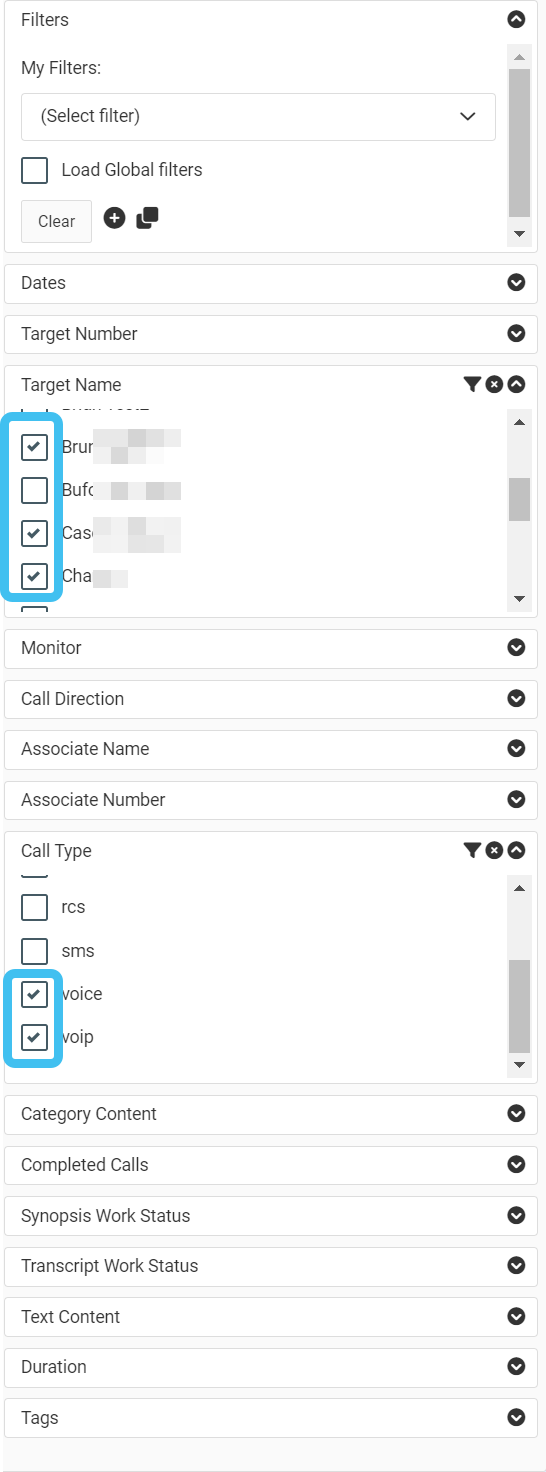
You can use filters created by your monitoring supervisor or administrator by selecting Load Global filters, however you can also create your own worklist filters using the following procedure.
On the Live Monitoring screen, select the filters you want in your custom filter.
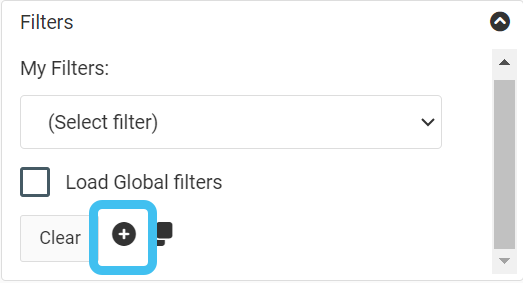
Expand Filters then click .
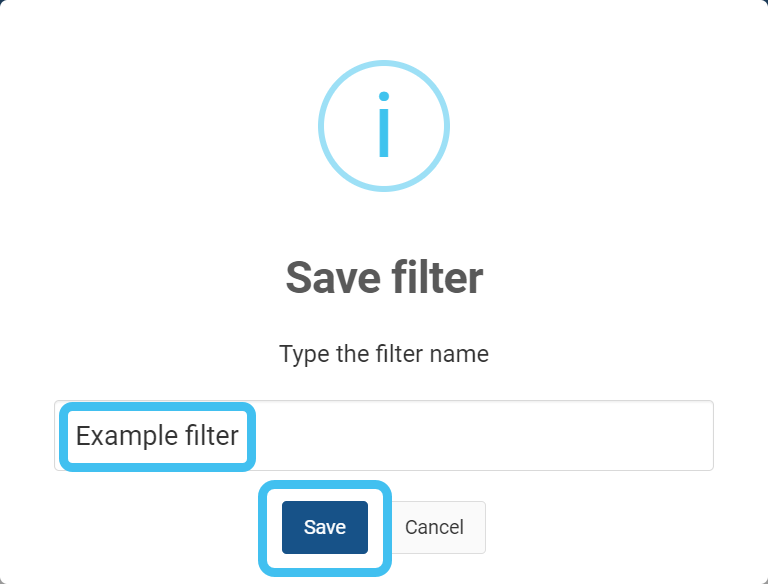
Enter your filter name and click Save.
Your new filter is now available in the My filters menu.
If you want to make changes to your filter, change your filter selections then click .
How do I create evidence management and reporting?
How to create evidence management reports
For the case you want to create a monitoring report for, open the Evidence management and reporting screen. You can do this either from the Live monitoring screen or the Manage case screen.
On the main menu click View cases. The screen that opens depends on your setting of View cases. If it is set to:
Advanced view, then the Advanced view cases screen opens.
If your case is listed on the Favorite & recent cases tab, click the case name to open the Manage case screen.
If it is not listed on the Favorite & recent cases tab, then click the Cases tab. Use the search filters to help locate your case. You can also click to open the FILTERS group which allows you to set your own default filter defining what is displayed on this tab, for example you may wish to set it to cases that you created which are currently open.
If your case is listed under My recent cases click it to open the Manage case screen.
If it is not listed under My recent cases then select your case from the table, using the search filters to help locate it if required. Note, by default the search is set to only display cases that you created; if you are not the original creator but an assignee then ensure you set Case filter to Assigned cases before clicking Search.
Tree view, then the View i-cases screen opens.
Click at the top-right of the screen to open either the View Cases or Advanced view cases screen and follow the above description.
On the Manage case screen click Evidence management and reporting above the Sentinel i-cases group.
The Evidence management and reporting screen opens.
In Court authorization information, either select a specific court authorization id or select Discovery.
If you selected Discovery, then in Start date and End date, select the dates of interest.
If you selected a court authorization id then the dates are automatically populated but you must select either a 10 Day, 30 Day or Court authorization period.
By default all the target phone numbers in the case are included but if you only want certain target numbers then select them in Case target numbers.
In Report options, select the information that you want included in the report for the selected events.
For Court authorization period you typically want to include all the events. For others, you may want to include the:
HI2 information, this is referred to as the Intercept Related Information (IRI) and is the pen register data.
HI3 information, this is referred to as the Contents of Communications (CC) and is the wiretap content.
GPS ping information, sent by the operator.
Social media information, sent by the operator.
Google Earth files, this produces an easy to view Google Earth output of the location information.
Click View working copy.
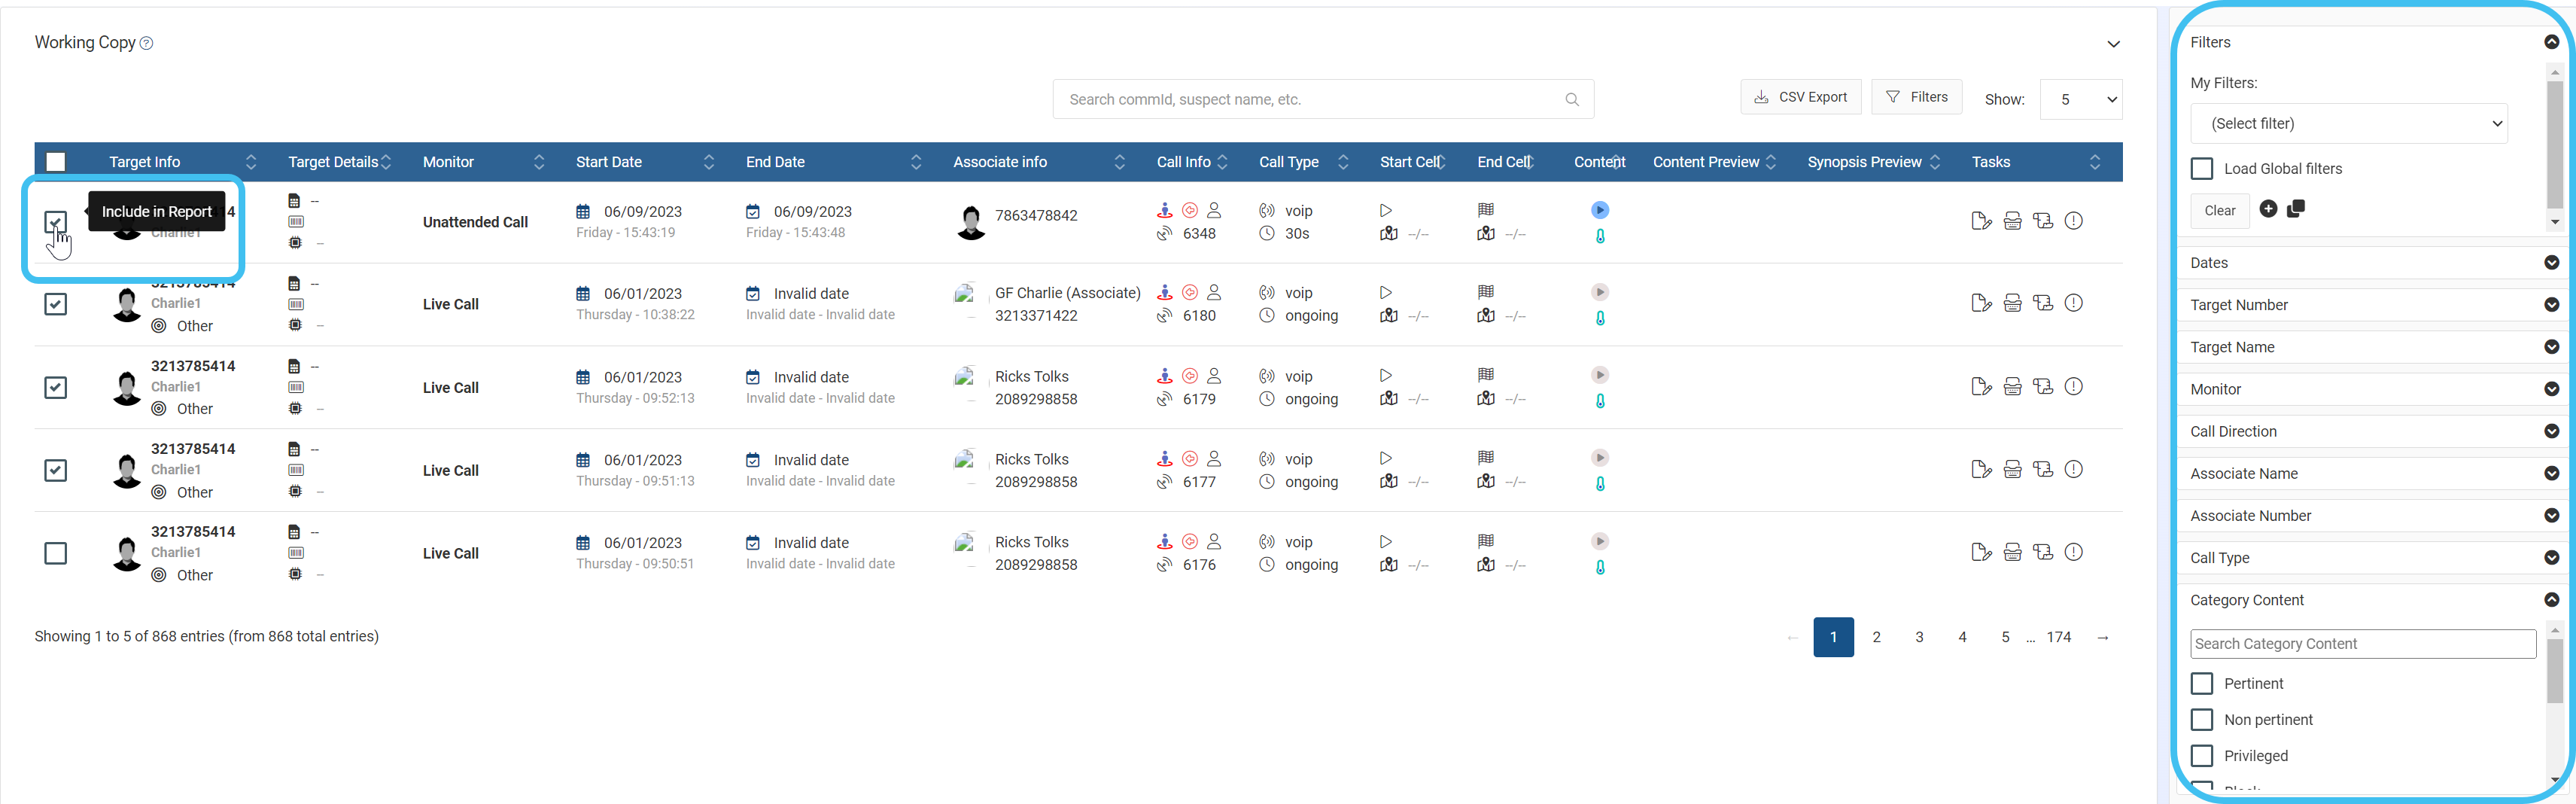
In Working copy, OSS-ESPA displays all the monitoring evidence data that matches your selected criteria.
Use the check-boxes to select which events you want to include. If required, you can use the filters to quickly locate the events you want to include, for example you may want to set the Category Content filter to only display Pertinent events.
Click Generate report.
A link to the completed report is emailed to you, and is also available to download directly from the IQ packets (reports) section of the Manage case screen.
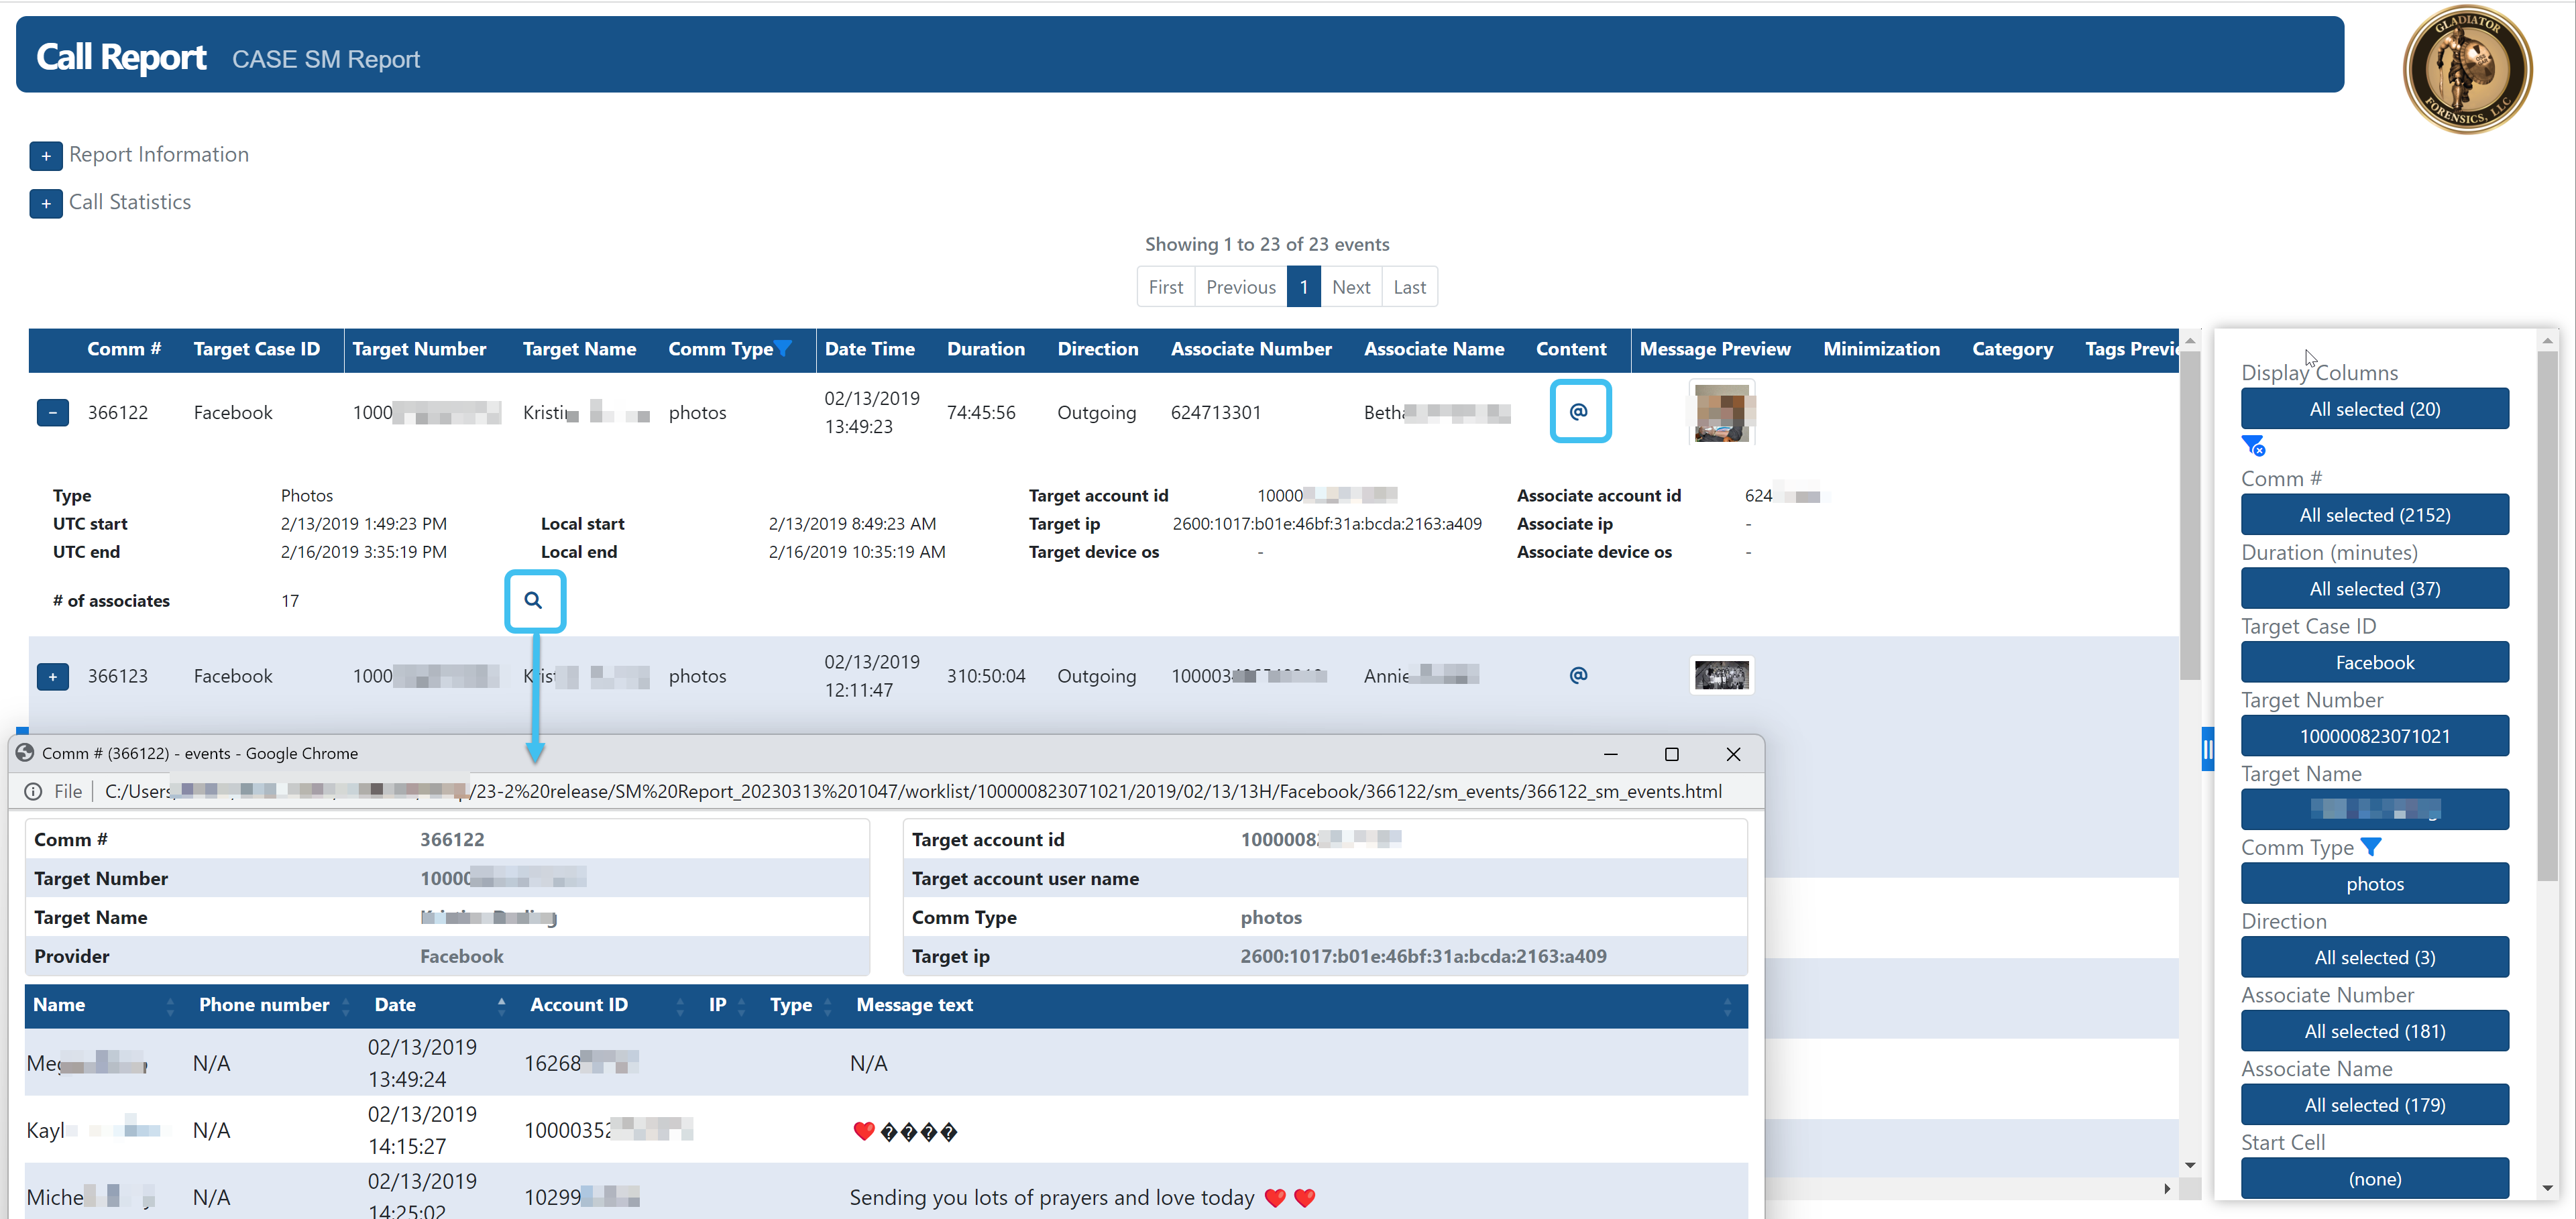
The report is output as an interactive easy-to-use html file. A summary of information about the case and the call statistics are provided at the start of the report followed by a list itemizing each event that you selected to include. For each event, links to the location, synopsis, transcript and notes histories are included. You can also view SMS and MMS content, replay voice calls and view social media data.
NOTE: The content of events with the categories of: Blocked, Privileged, Uncategorized and Not Monitored is not included in the report.
To view social media content, such as picture, click @ in the Content column. To open the communication in a separate window, click .
Filters are available on the right of the report, allowing you to search on a variety of columns such as the comm # and communication type.
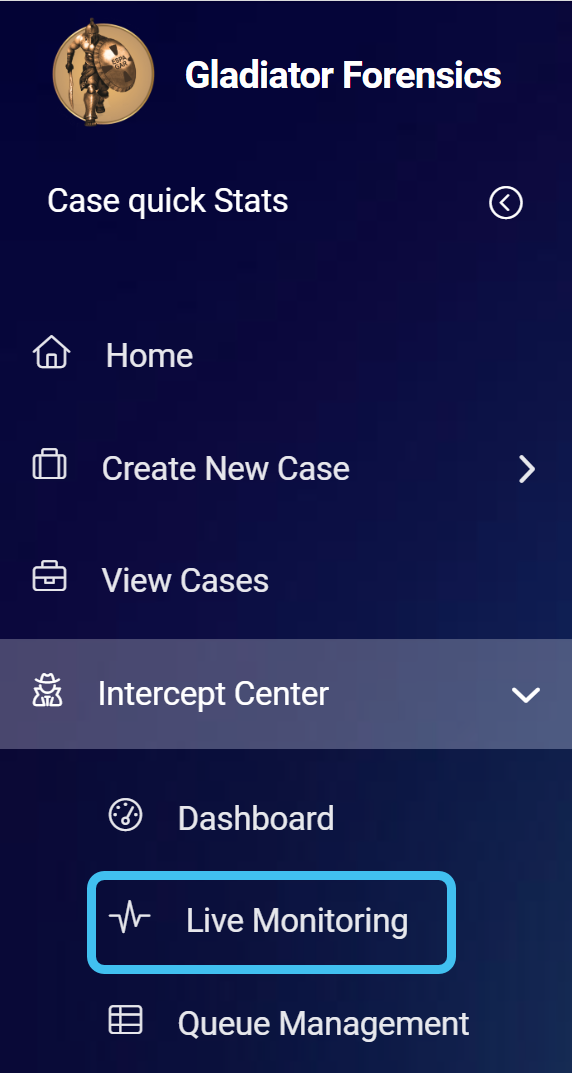
On the main menu click Intercept Center, then click Live Monitoring.
The Live Monitoring screen opens.
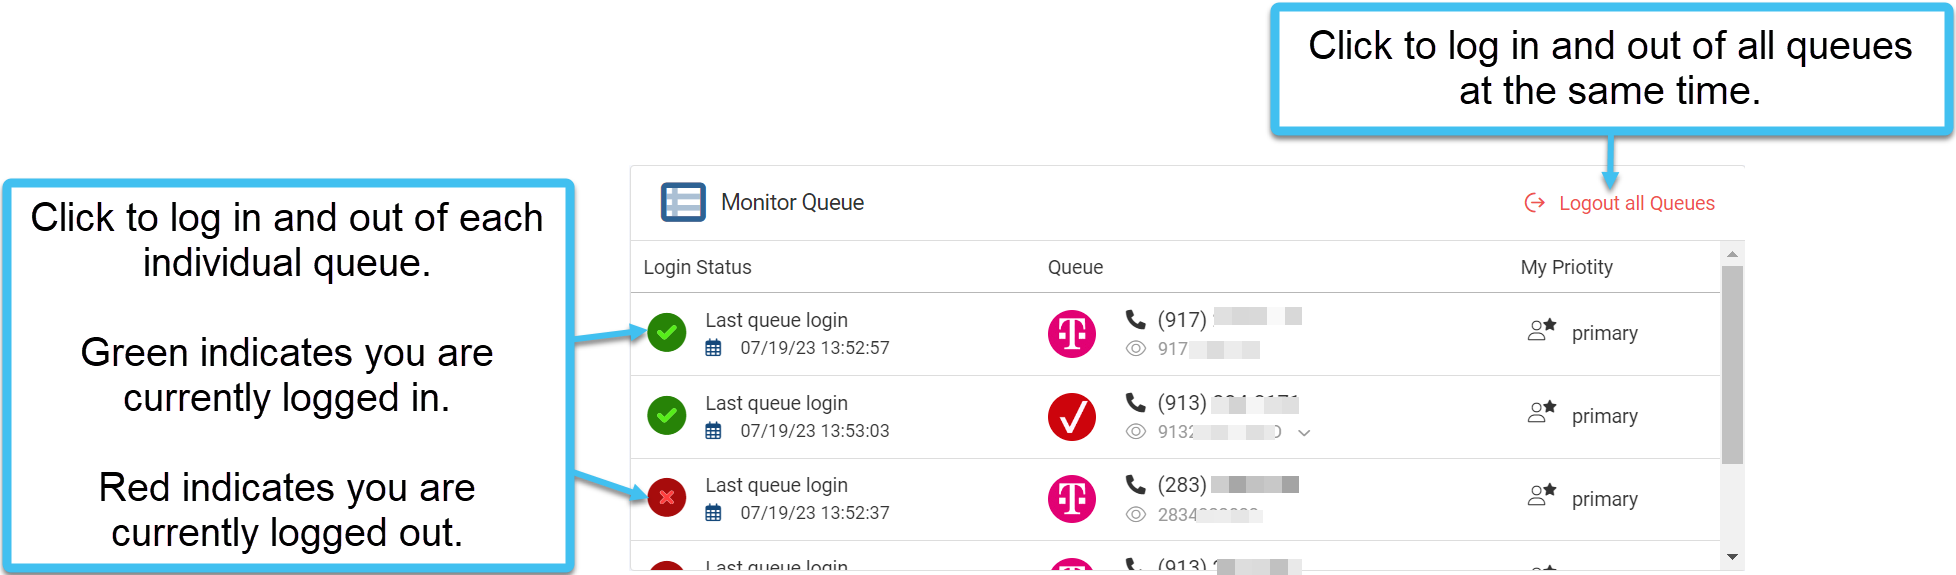
Click , or select an individual number to log in to by clicking .
Now that you are logged in, active communications are routed to you.
NOTE: It is important that you log in to start live monitoring so that communications are routed to you. It is also important that you log out when you are unavailable to take communications so that active communications are not routed to you.
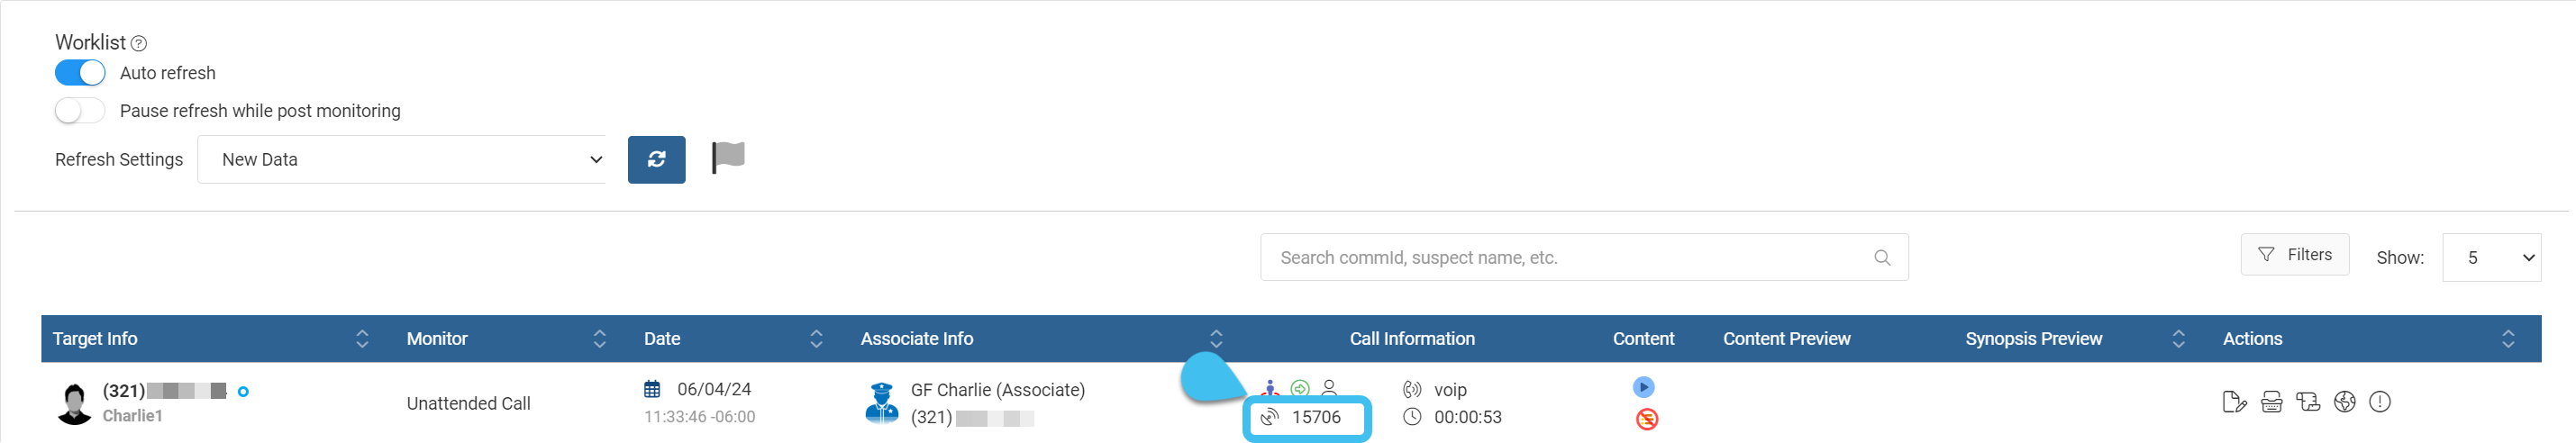
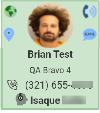
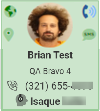
When a communication is routed to you, the monitored subjects icon changes color and may be flashing which represent different states as shown in the following graphic:
If the call is a voice call then the T3/T50 Realtime Monitoring, Categories and Synopsis dialog boxes open automatically. For data and messaging you can click the icon in the Content column to view the communication.
While monitoring the voice call you can:
Enter text in the Synopsis dialog box to capture key information. Any text you enter is locked and cannot be edited by another monitor.
Click to minimize the call if the discussion is not relevant. This pauses the call for a number of seconds and places "minimized" sounds on the recording trace.
Click then select to terminate the call monitoring. You may want to terminate the call if it is privileged, not pertinent, or if another call has started that is a higher priority for you to monitor.
NOTE: Terminating monitoring means that the call can no longer be monitored by you, or any other monitor. This is different to you logging out of the queue as in this instance the call is then made available to other monitors.
Click then select to transfer the call to another monitor if you have to attend to something more urgent.
A menu appears showing all the monitors that are available to take the call. For a monitor's name to be displayed:
the person must be a monitor and must be logged into the queue.
this monitor cannot be listening to any other active calls as a primary or as a backup.
this monitor cannot be listening to any other active calls as an observer.
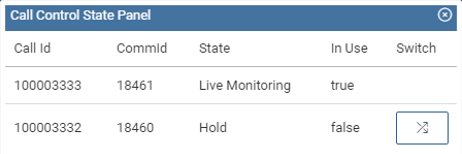
If there are multiple calls with the target then click to open the Call control state panel that allows you to click to switch to another call. Currently the Call control state panel does not distinguish what each of the calls are. Note, the Call id column is currently for Gladiator Forensics internal use only.
Multiple calls can happen:
when the operator is supplying two legs for the same call. It may be the case that one leg is better quality than the other so you can switch between them to listen to the one with better quality.
when another associate calls the target and the target attempts to do a 3-way call.
when there is a call on hold while the target speaks to another associate.
As a monitor you should be aware of your queue status to ensure you are monitoring all your intended subjects. You can view your queue status on three areas of your Live monitoring screen.
Queues Logged In/Out, at the top-right of the screen, shows how many subjects of those you are assigned that you are currently logged in to. In the following example, 4/5 indicates that only 4 of 5 assigned subjects are being monitored.
Monitor Queue, at the top-left of the screen, displays your queue status.
indicates that you are logged into the queue and monitoring the subject.
indicates that you are not logged into the queue and therefore not monitoring the subject.
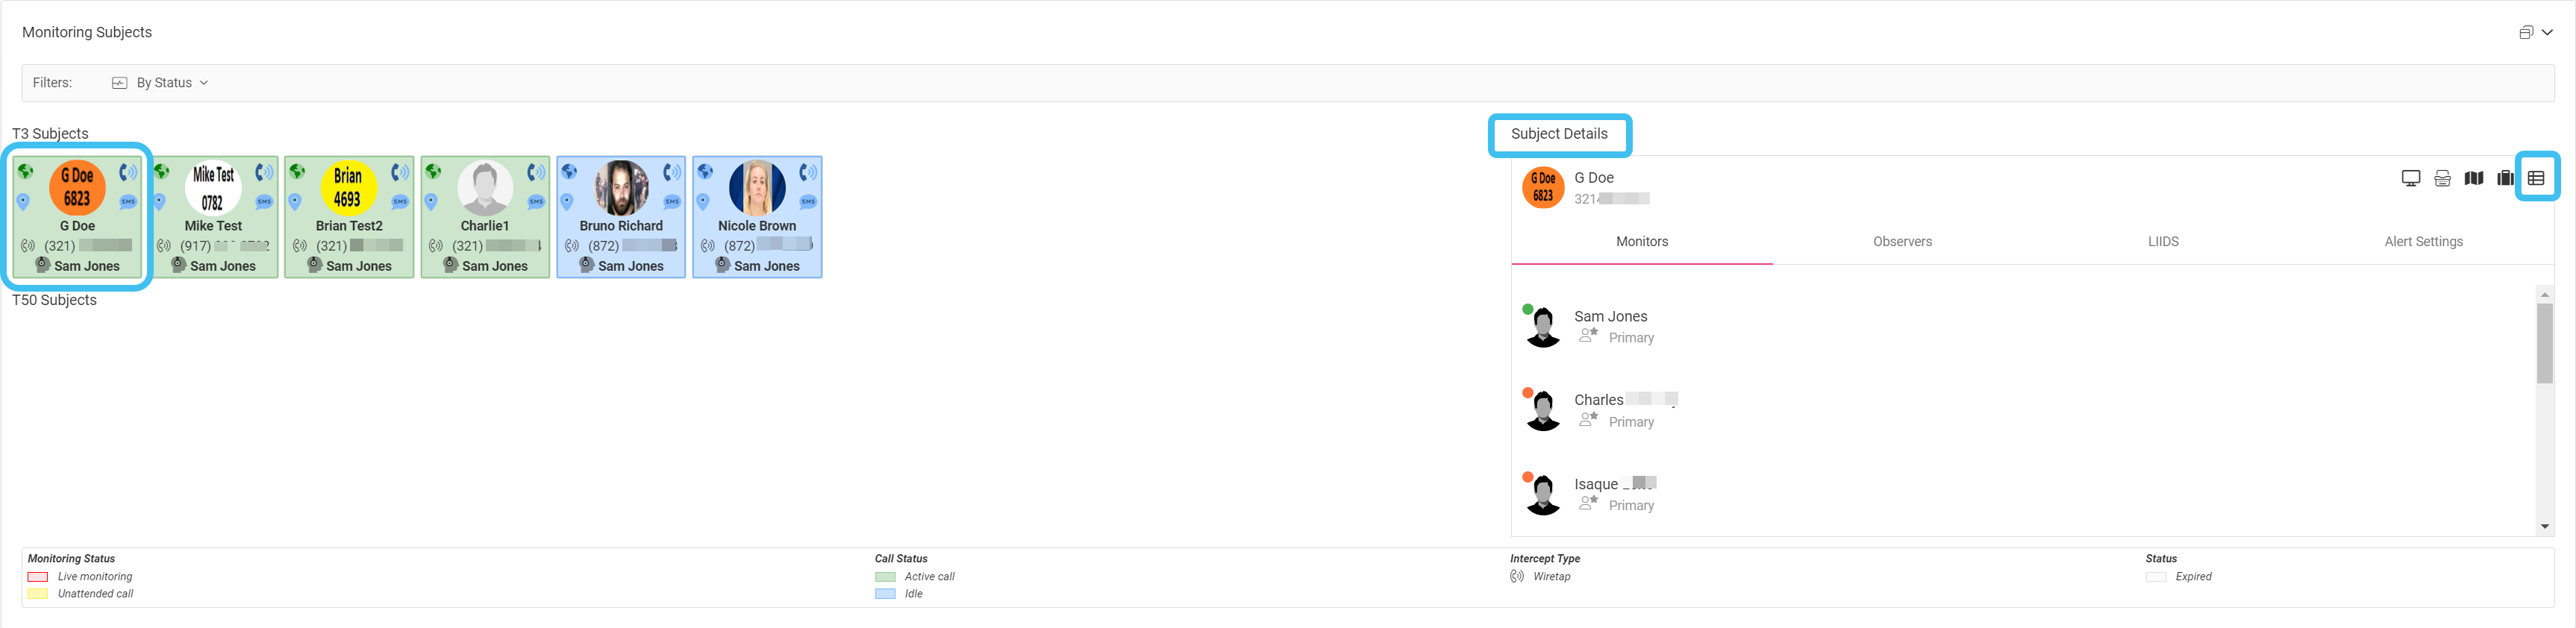
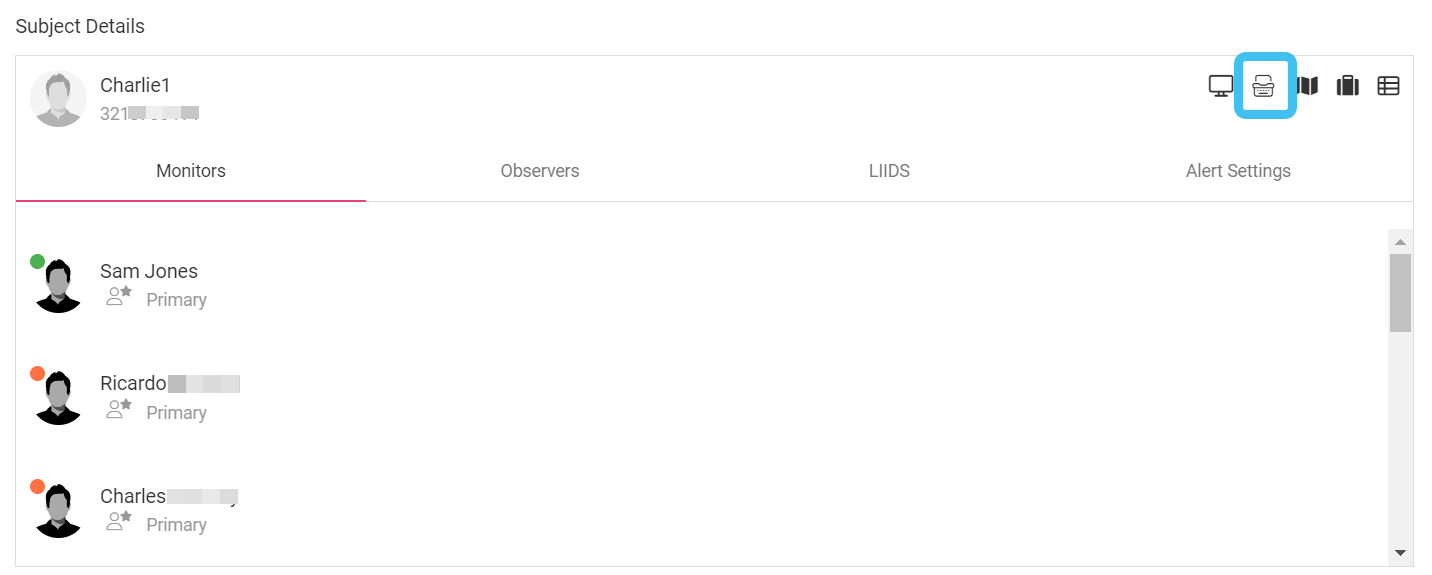
Subject Details displays all the monitor's names that have been chosen to monitor the subject and their priority in the queue. A red or green circle displays beside each monitor which indicates whether or not they are currently logged into the subject's queue. This is useful if you are a supervisor as it allows you to see which monitors are assigned to monitor the subject and which are currently logged into the queue.
For the case you want to add a wiretap to, open the Manage case screen and in the People and device section click their name.
The People and device screen opens.
Click , then click and select Intercept monitoring.
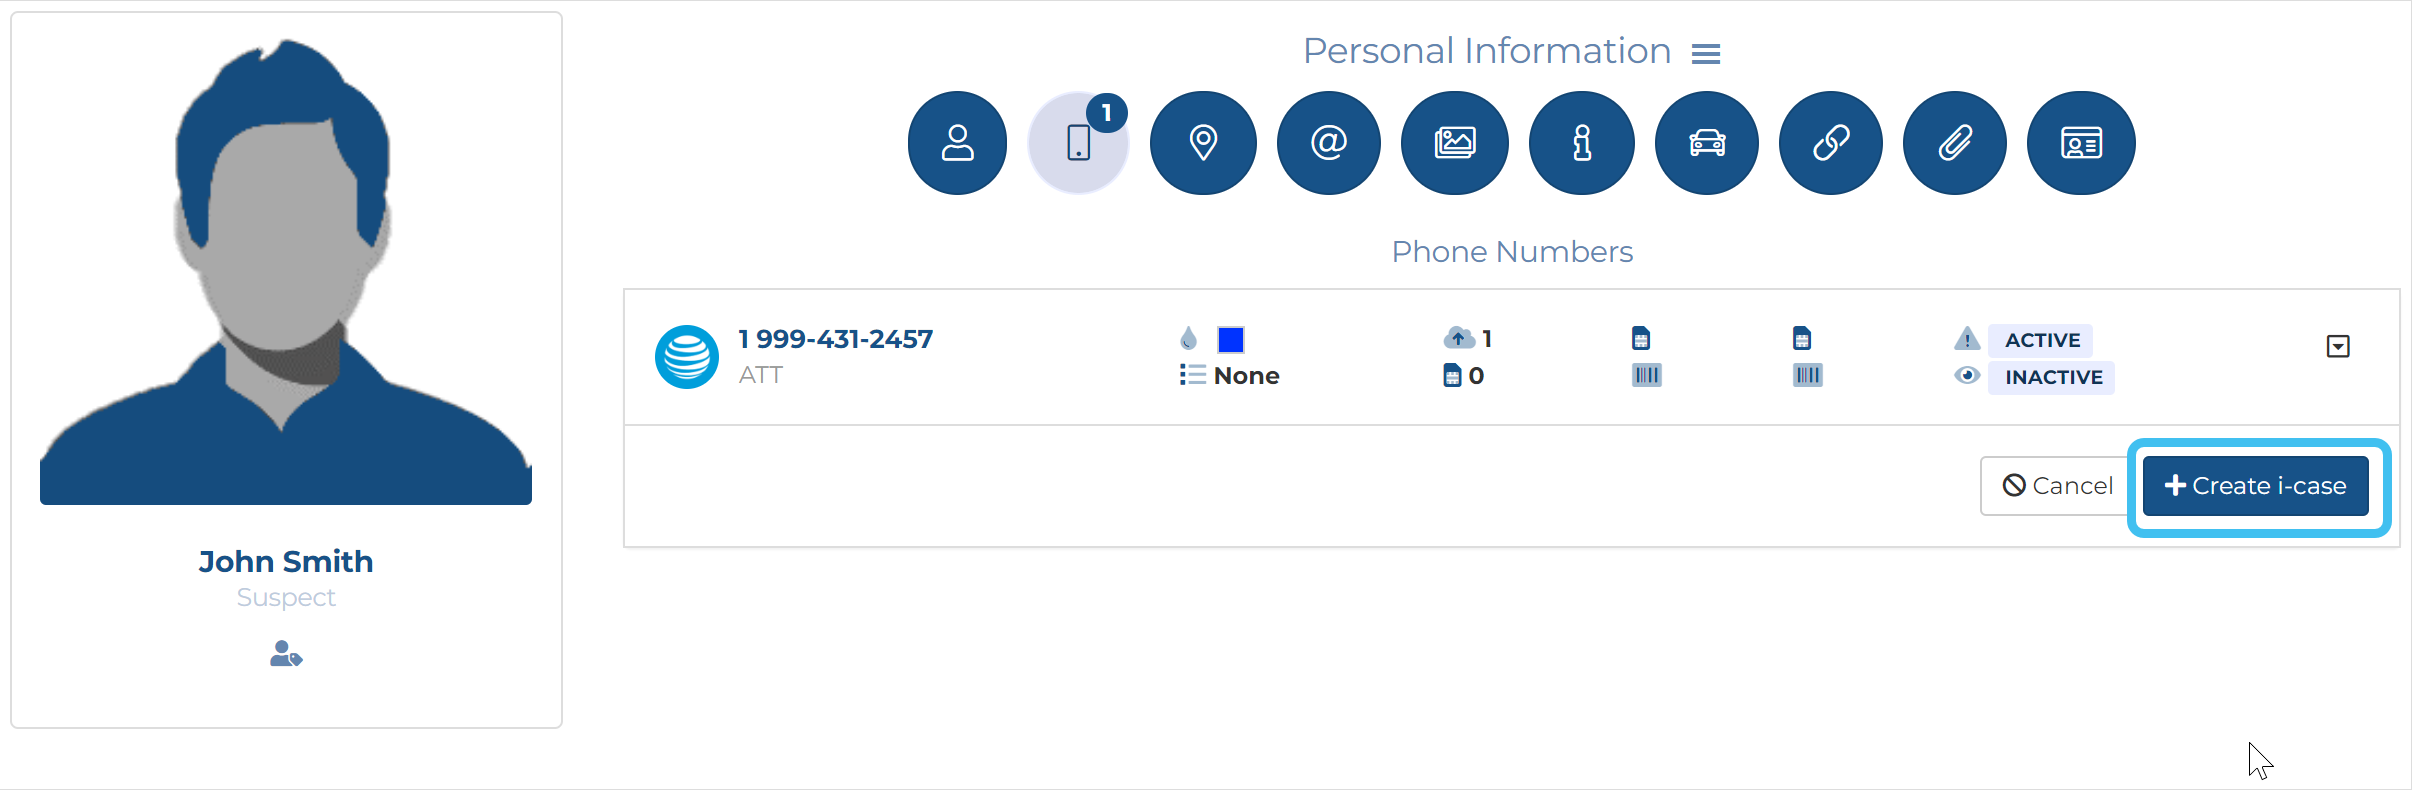
Click Create i-case.
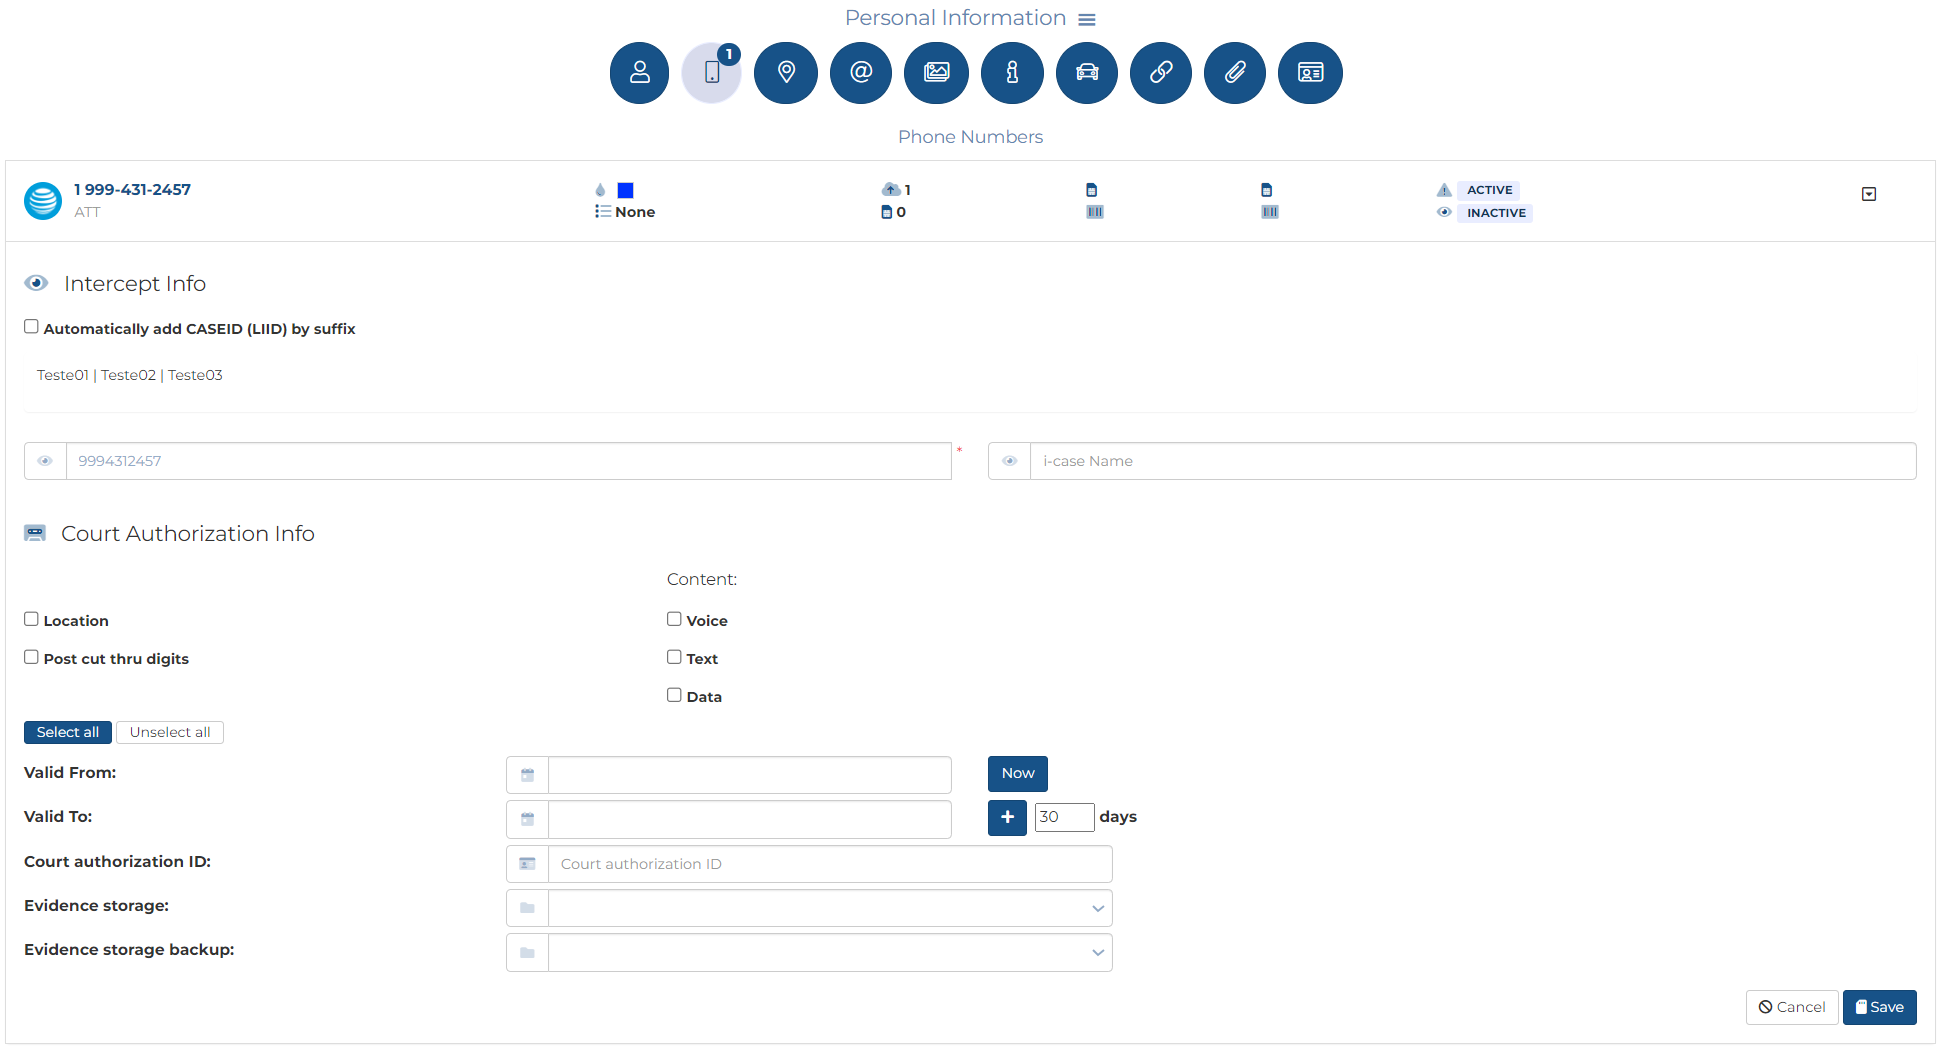
In Intercept info:
If your administrator has created suffixes for the selected operator then you have the option on which method you use to enter the CASEID (LIID). If not you can only use the manual option. Either:
Manually enter the CASEID (LIID):
In CASEID (LIID) enter the lawful interception identifier. This is the only mandatory setting, all others are optional although it is strongly recommended that you also enter a person name and phone number.
In i-case name enter a name for the i-case if you prefer to use a name rather than the CASEID (LIID). This is then used, rather than the CASEID (LIID), on the OSS-ESPA screens and the G-Scout App to identify the i-case.
Automatically enter the CASEID (LIID):
Select Automatically add LIID by prefix/suffix.
In Prefix and Suffix, if available, select the ones you want appended to the phone number.
In Court authorization info:
Select Locations if your warrant has authorized cell site locations.
Select Post cut thru digits if your warrant has authorized them.
If your intercept monitoring is for wiretaps, then in Content select which types of communication content your warrant has authorized. Note, this setting is not applicable for PRTT.
In Valid From and Valid To, enter the dates that the CASEID (LIID) is approved for. The monitoring will end when the valid to date expires. You can use the date pickers to select the dates. However, if you want the Valid From date as today's date then click Now and if the monitoring is valid for a specified number of days then select the number of days then click +.
NOTE: When entering the Valid From and Valid To date you must take into consideration the timezone of date/time on the warrant versus the timezone of your OSS-ESPA system. The timezone of your system is displayed above these settings. For example, if the timezone displays "Eastern Standard Time (-5.00)", and the warrant's date/time is in Eastern Standard Time then you must enter the warrant's date/time in Valid From and Valid To. However, if your warrant is in Pacific Standard Time then you must increase the time entered in the Valid From and Valid To settings by 3 hours.
In Court authorization ID enter the search warrant identifier. This is then included in Evidence Management and Reporting.
If your intercept monitoring is for wiretaps, then in Evidence storage and Evidence storage backup, select the paths you want used for archiving the case's Sentinel data. Note, this setting is not applicable for PRTT.
Click Save.
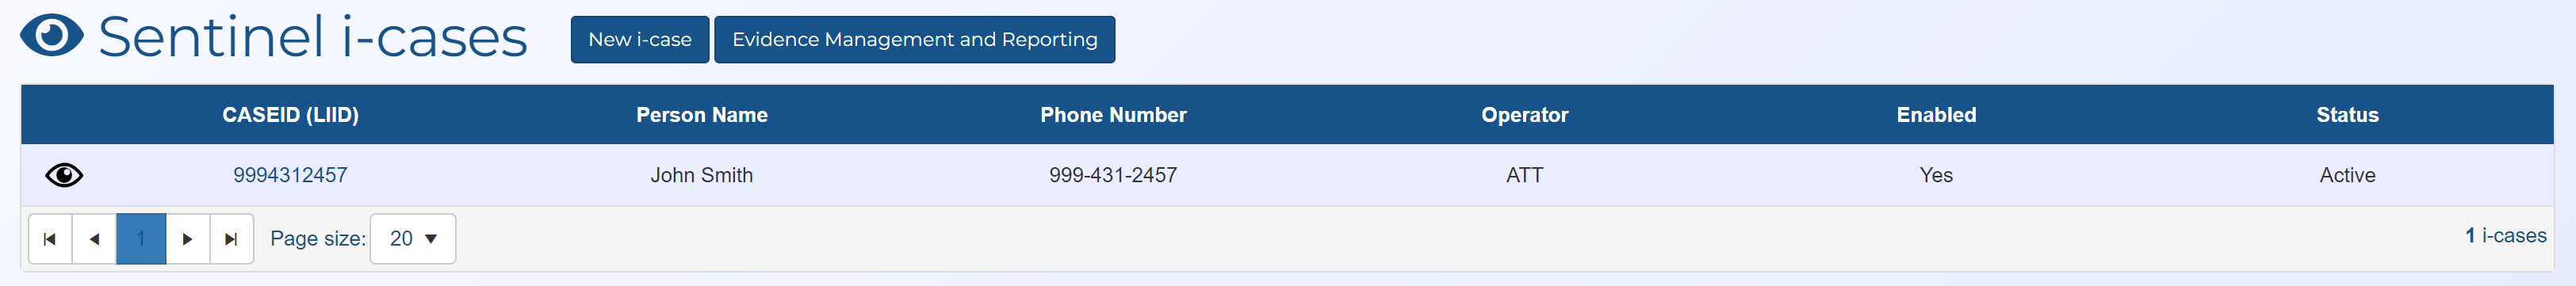
To verify your intercept is configured, ensure it displays in the Sentinel i-cases section on the Manage case screen.
When OSS-ESPA receives the first PRTT data or GPS ping from the operator it sends an email to the case creator, case assignees and administrator to notify them that the first alert has been received. The email is titled "First Data <person name> - First Data ALERT". Note, administrators can change who receives these emails using Send "First data alert" notification for administrators and Exclude domains.
You can add tags to notes, synopsis, transcripts and translations, and once added you can search on and filter the communications by the tags to look for communications containing the same tags.
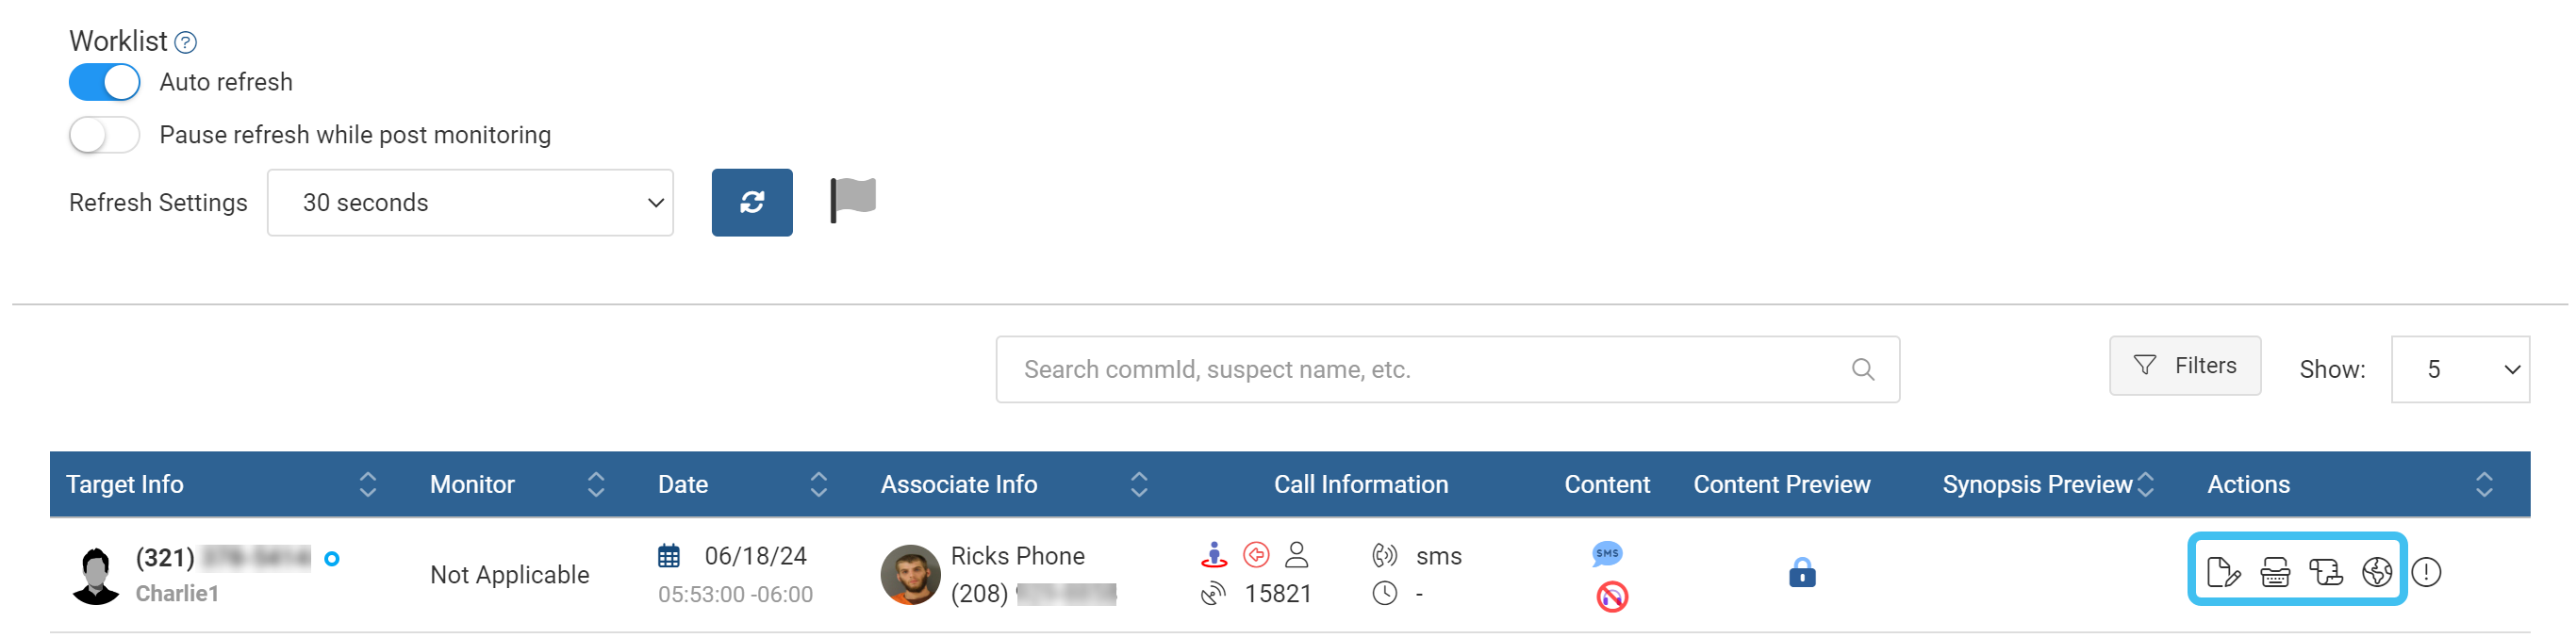
In the Actions column in your Worklist:
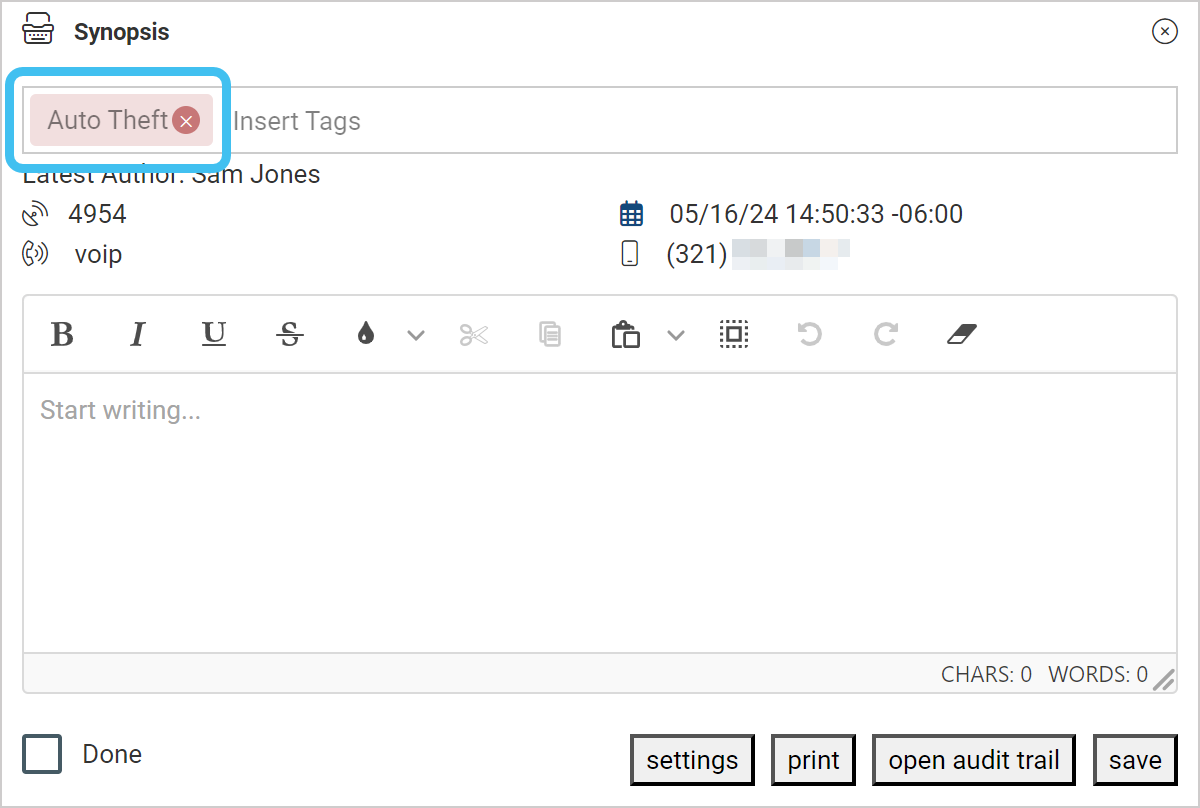
If you want to add tags to the Synopsis dialog box, click .
If you want to add tags to the Transcript dialog box, click.
If you want to add tags to the Notes dialog box, click .
If you want to add tags to the Translation dialog box, click .
In Insert tags, start typing the tag you want to enter. If the one you want is available, select it, if not keep typing to enter a new tag then click Save.
If you need to delete a tag click x to the right-side of the tag.
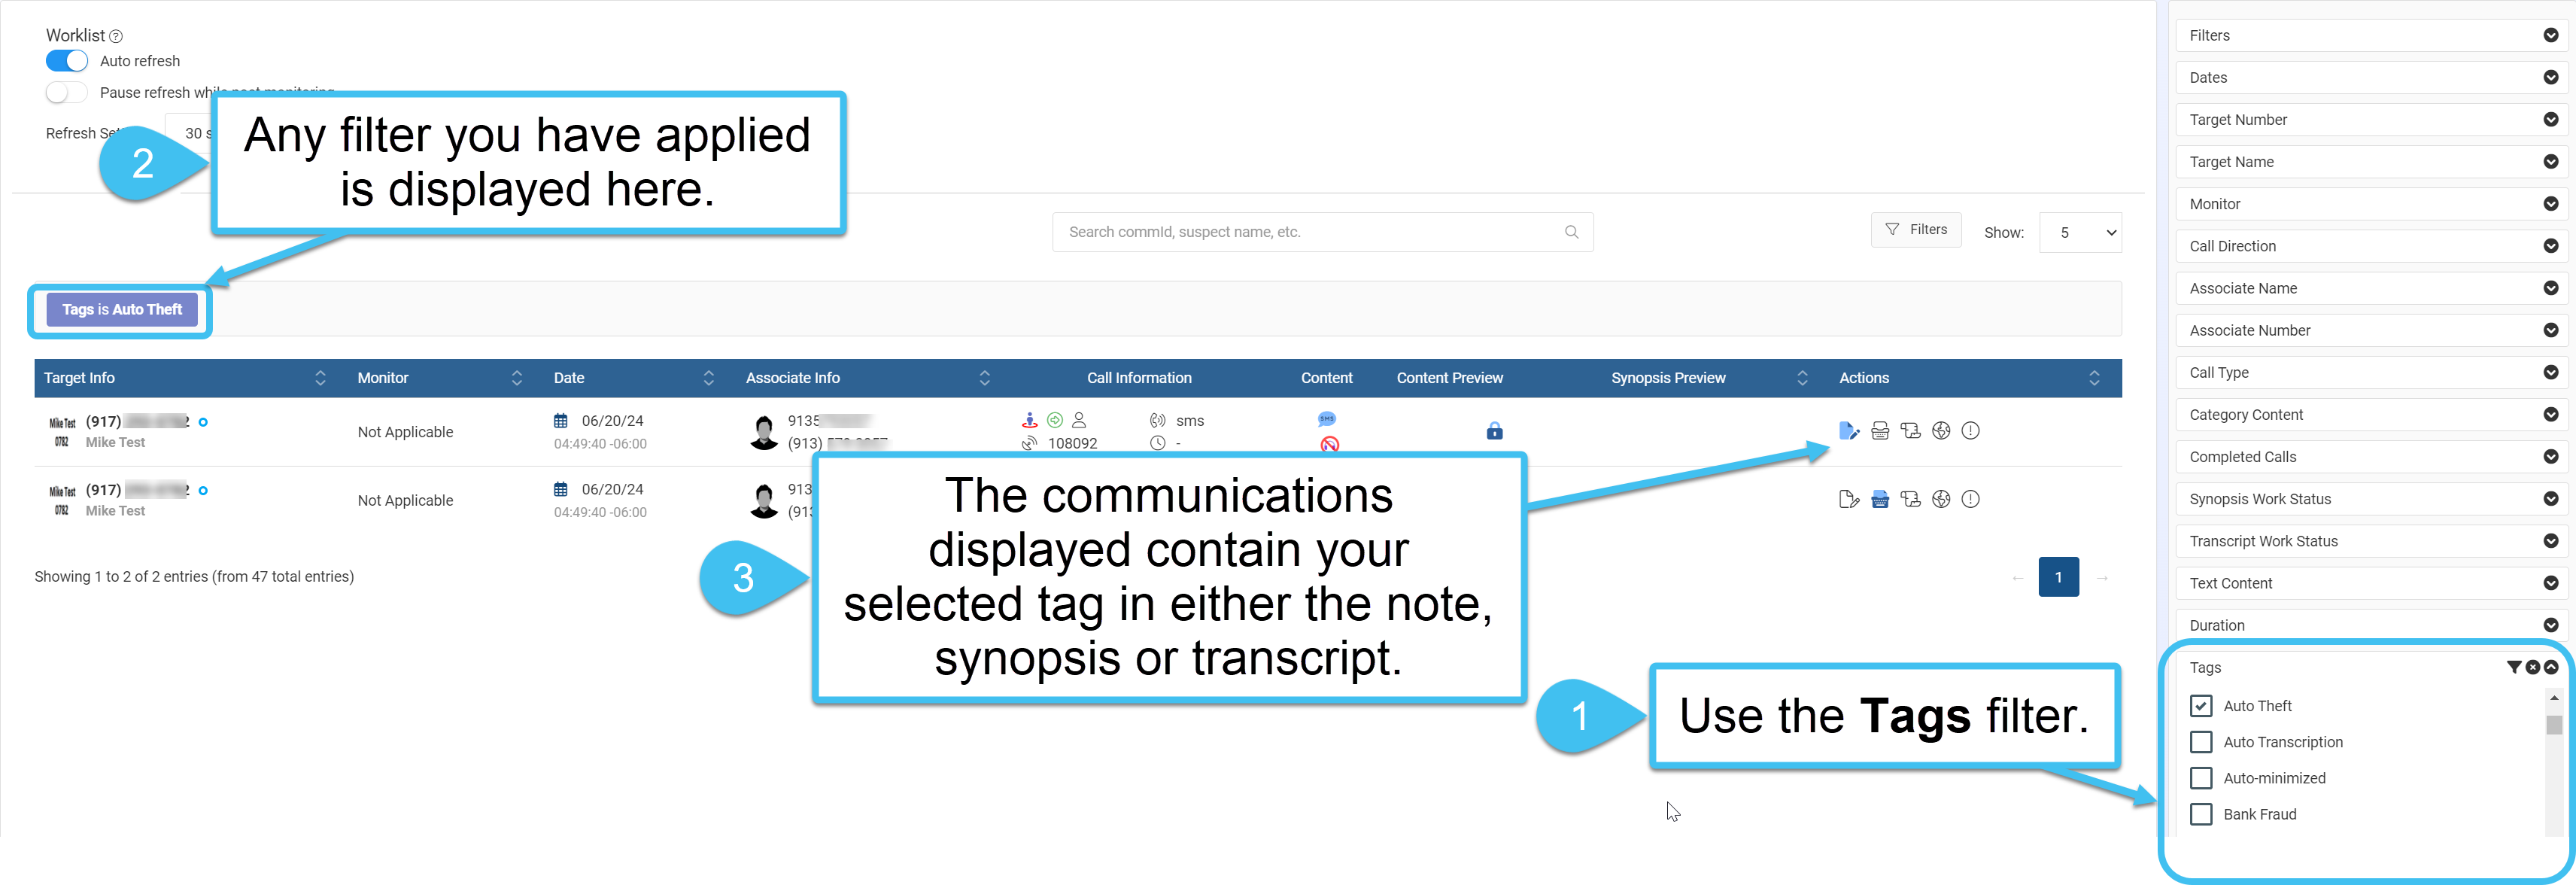
To filter by a tag, use the Tags filter to the right-side of the screen. Once selected, only communications containing the selected tags are displayed.
You can also use the search bar to find communications with a specific tag.
Note: For a new tag to display in the Tags filter you must first refresh the browser window.
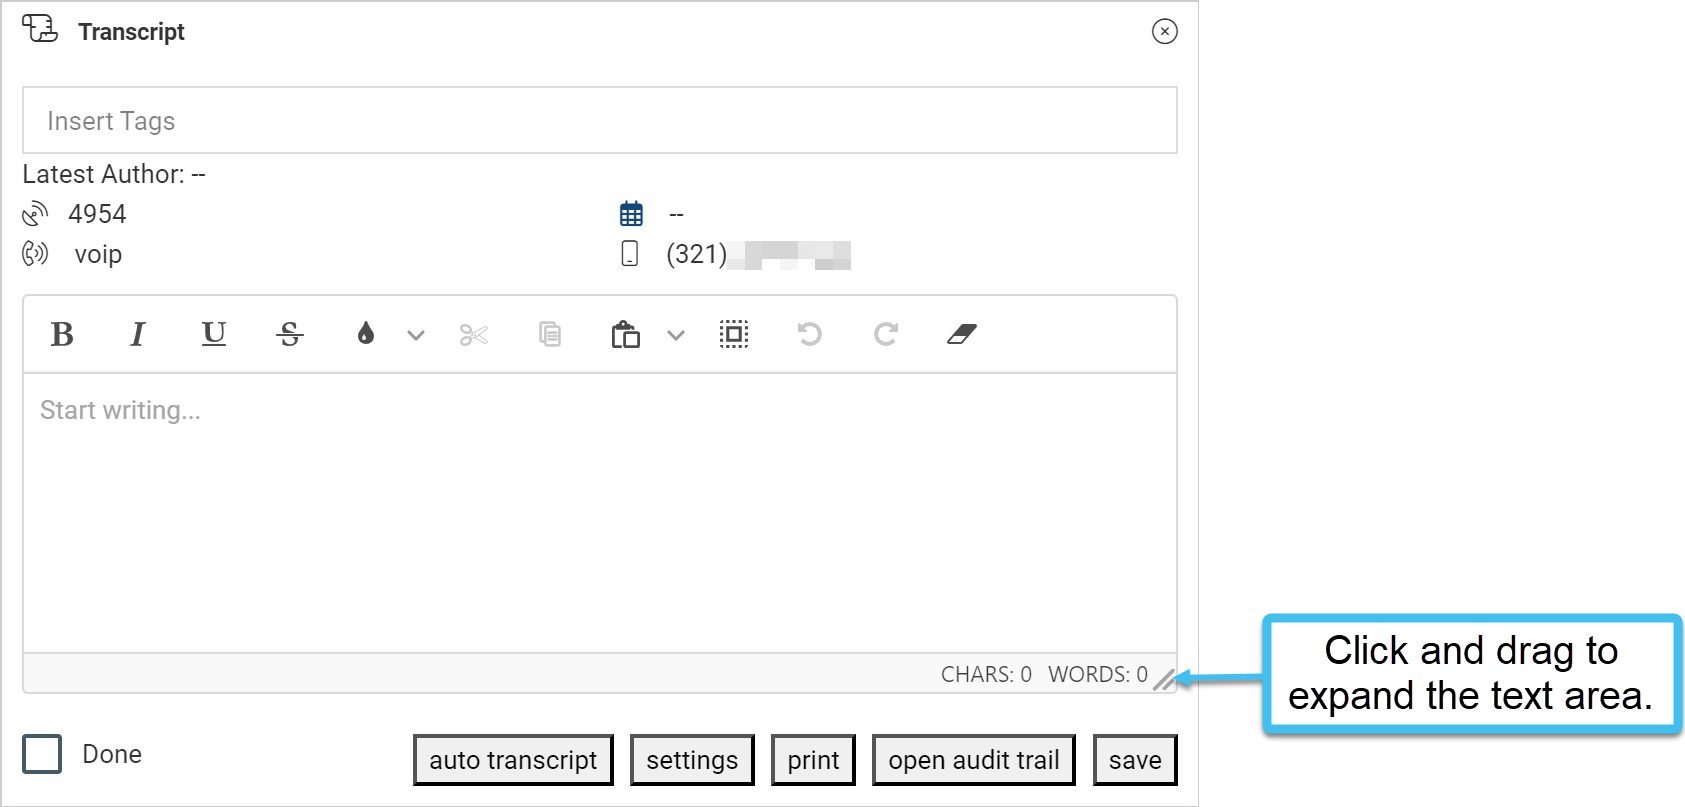
If required you can increase the size of the Notes, Synopsis, Transcript and Translation dialog boxes by clicking on then dragging the corner-triangle shown in the following graphic.
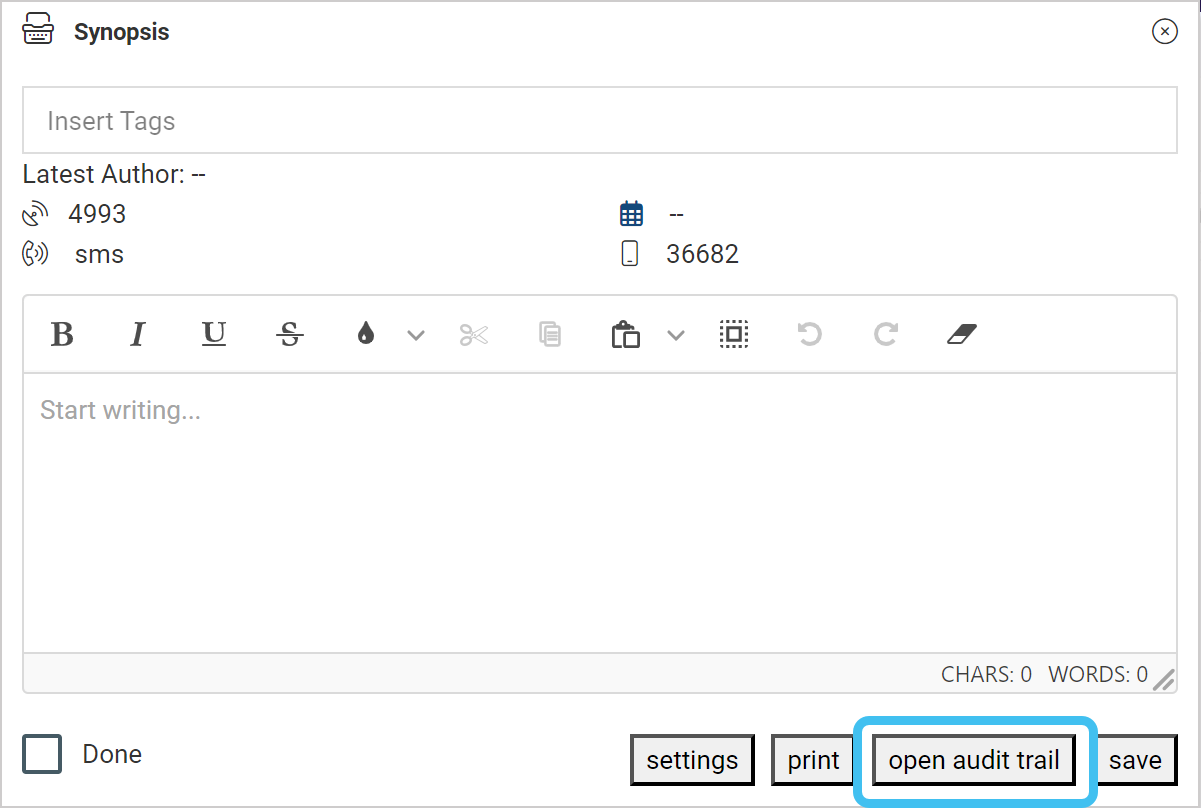
In the Actions column in your Work list click either (Notes), (Synopsis), (Transcript) or (Translation).
Depending on which icon you clicked, either the Notes, Synopsis, Transcript or Translation dialog box opens
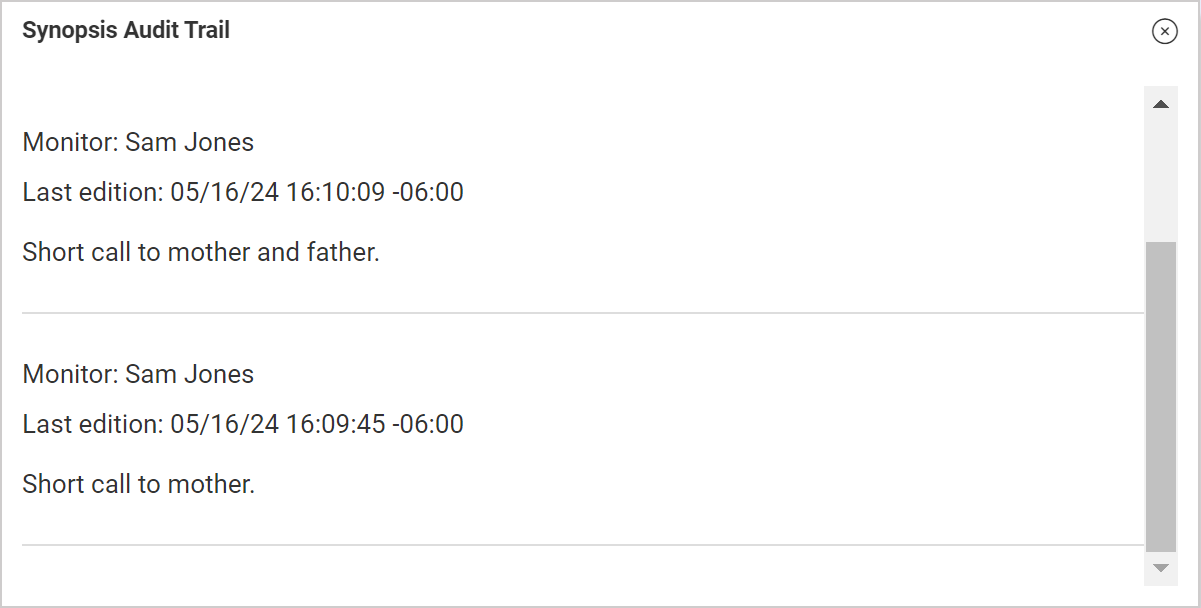
Click open audit trail.
Depending on which icon you clicked, either the Notes Audit Trail, Synopsis Audit Trail, Transcript Audit Trail or Translation Audit Trail window opens.
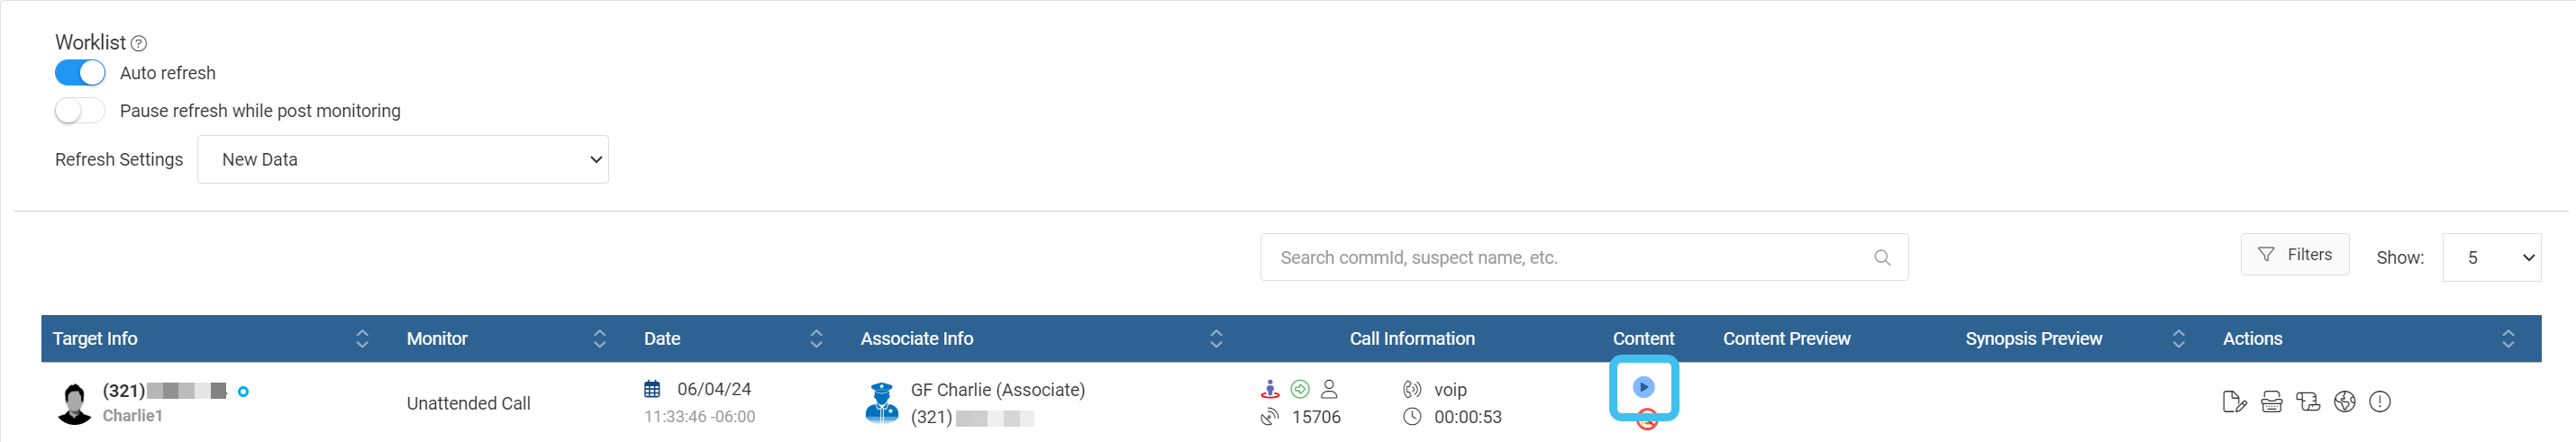
Click either , or in the Content column of the Work list to open either the Chat timeline view, Data timeline view or Audio playback window respectively.
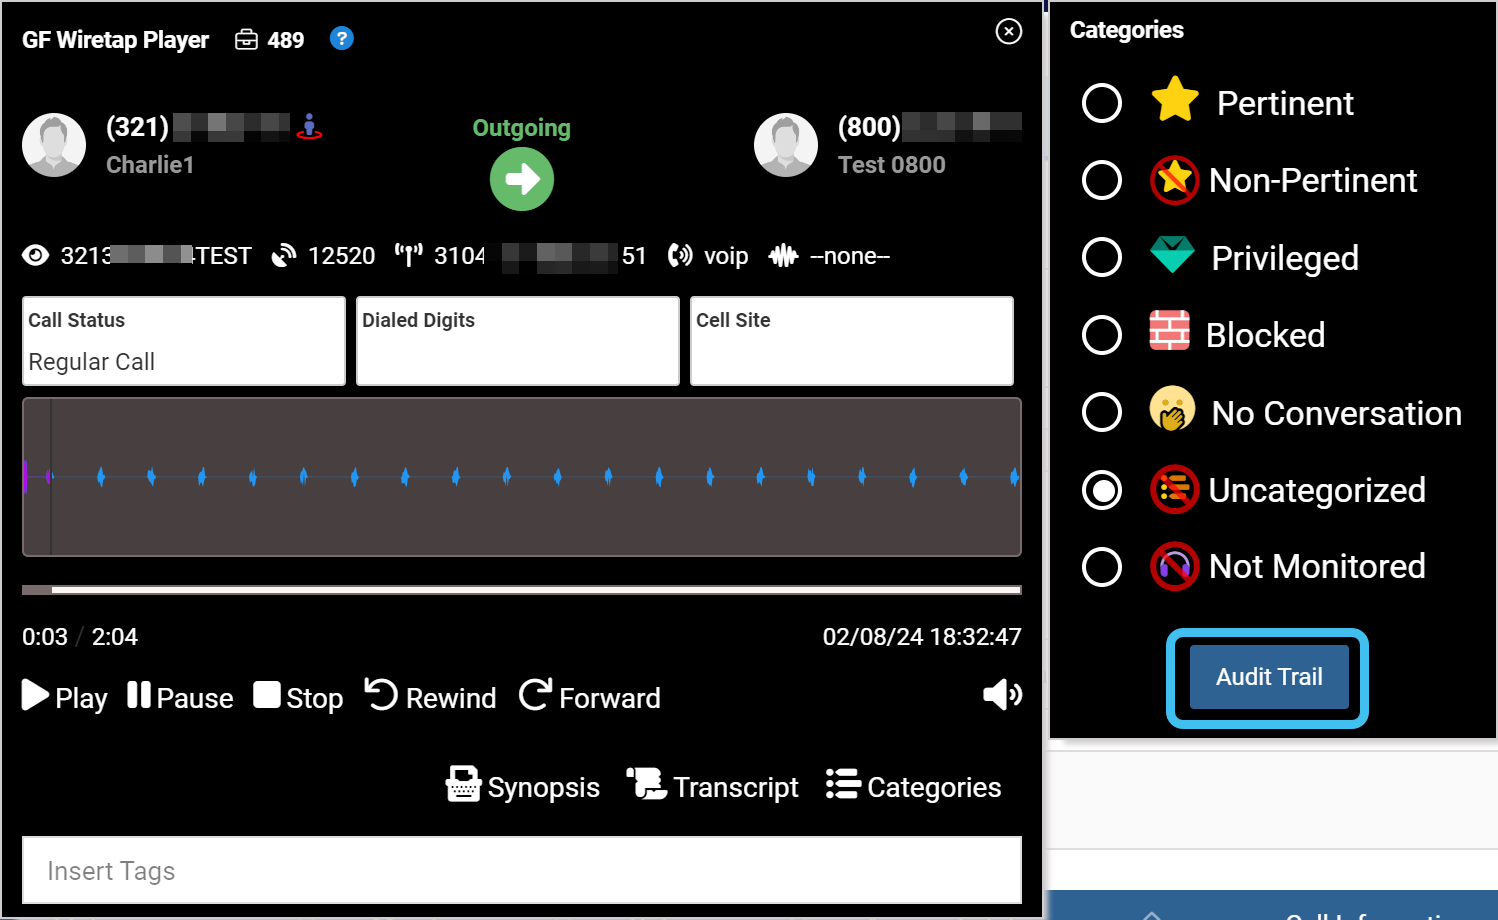
The Categories window is automatically displayed.
Click Audit trail.
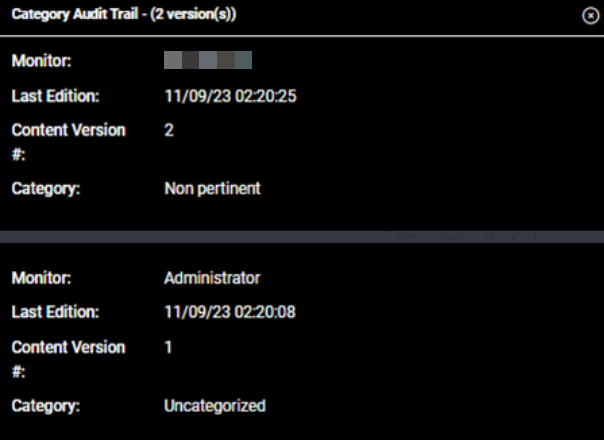
The Category audit trail is displayed.
NOTE: All non-voice communications, with no exception restrictions, are categorized as Not Monitored by default. Once opened by a monitor this automatically changes to Uncategorized until the monitor selects the appropriate category.
How do I view the location information when I am monitoring a wiretap?
How to view location information
If you want to view location information when you are monitoring a call it is recommended that you have the Sentinel screen open on a second monitor. For further information refer to Monitoring movement on the Sentinel screen.
What do all the different colors and icons mean on the subject icon?
Understanding the subject icon
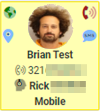
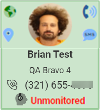
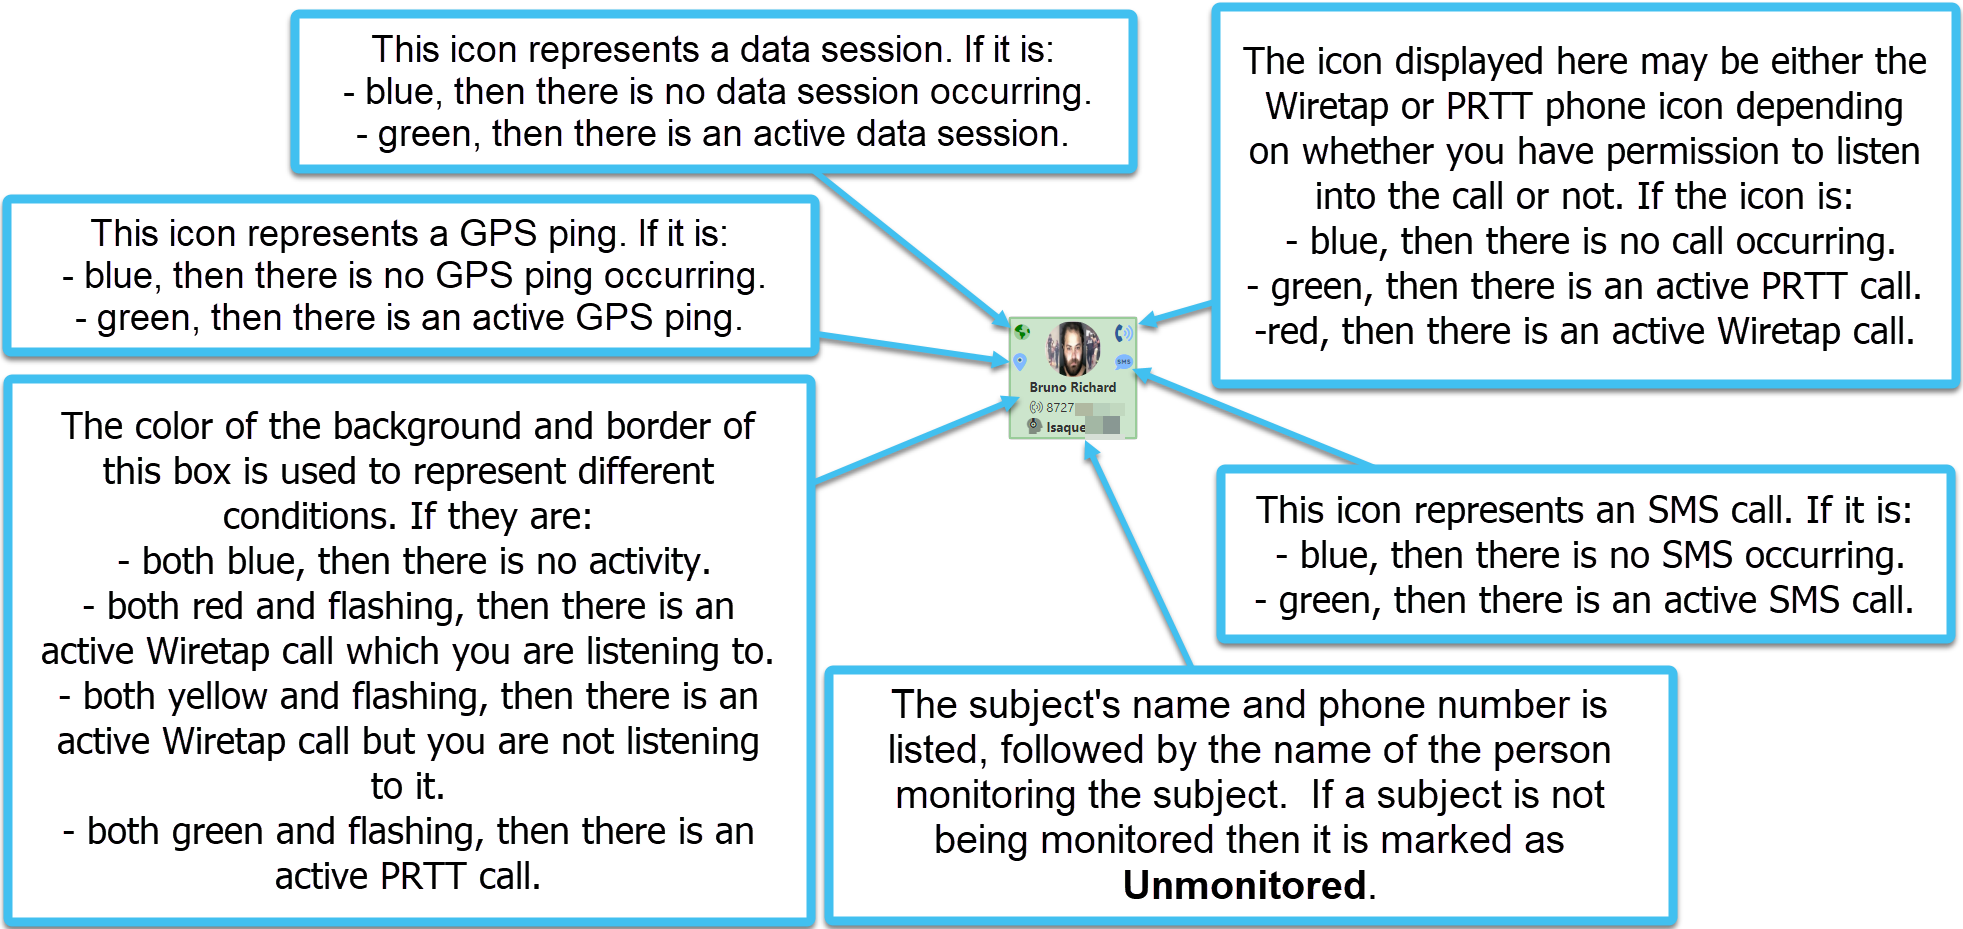
The details displayed in the subject icon are:
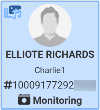
an events indicator containing four icons, one in each corner, which represent: data session, GPS ping, SMS call, and the intercept type which is either a wiretap call or a PRTT (Pen Registers Trap Trace ) call. All four icons display even if you have not been given permission to monitor them on the Queue management screen. If you are a monitoring supervisor, you can also listen into a monitored call by clicking the phone icon in the top-right corner.
The icons display in different colors and may be flashing which represent different states as shown in the following graphic:
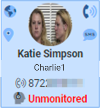
the name of the person monitoring the subject. If a subject is not being monitored then it is marked as Unmonitored. This information is useful if you are a monitoring supervisor as you can then communicate with other monitors to ensure you have someone log into the subject's queue.
For example:
Active data session
Active data session
Active location
Active SMS
Active data session
Active voice call
Call unattended
Active data session
No monitors assigned
No activity
No monitors assigned
Social media
Note, the social media icon only displays as blue as shown in the last graphic in the above table.
 Using Live monitoring for wiretaps
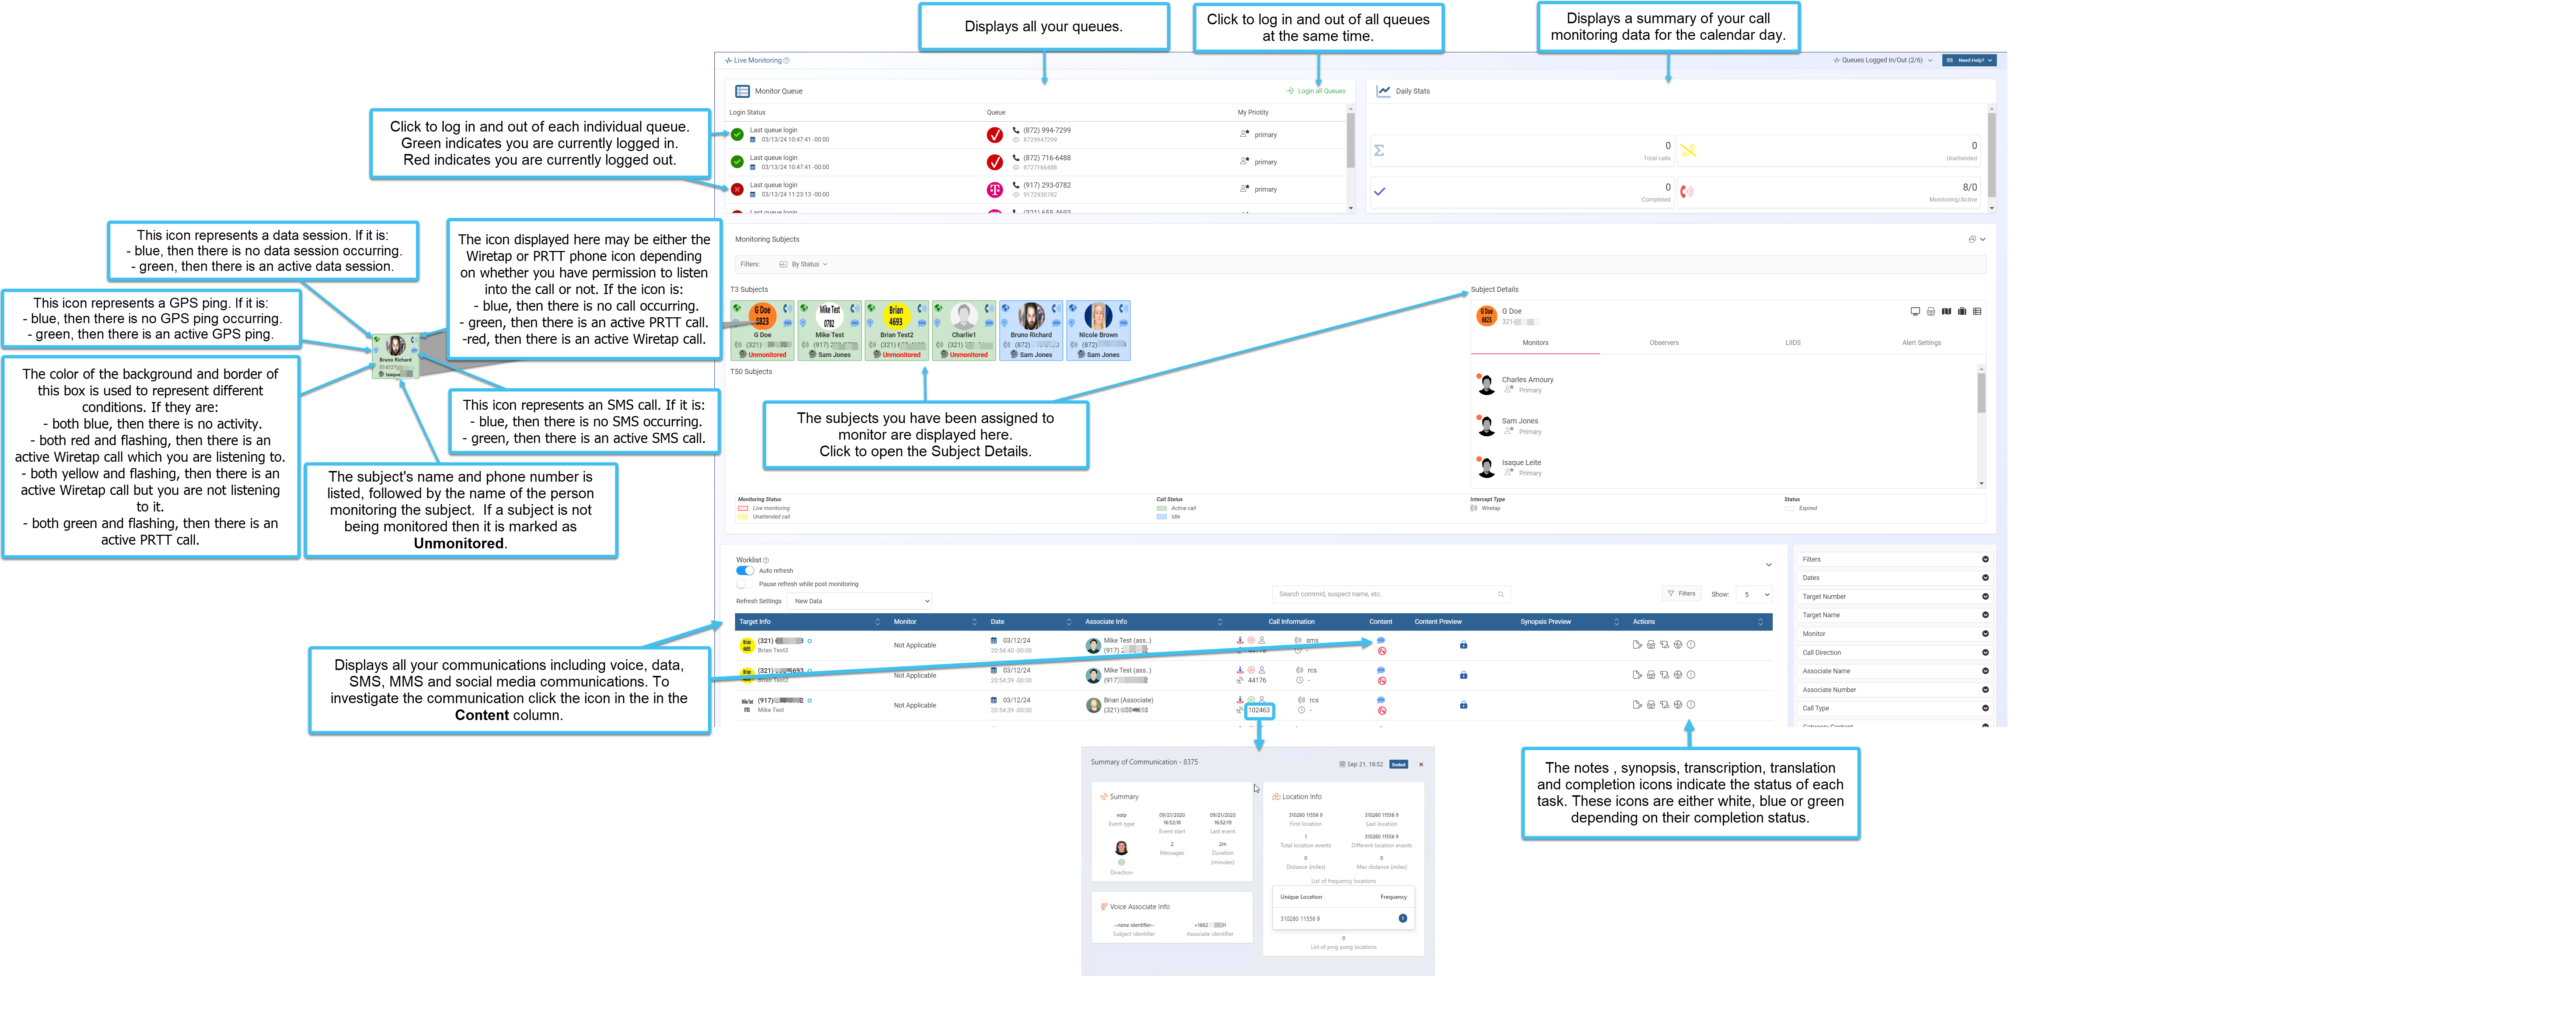
 .
.
 .
.
 then from the menu select
  alongside their phone number.
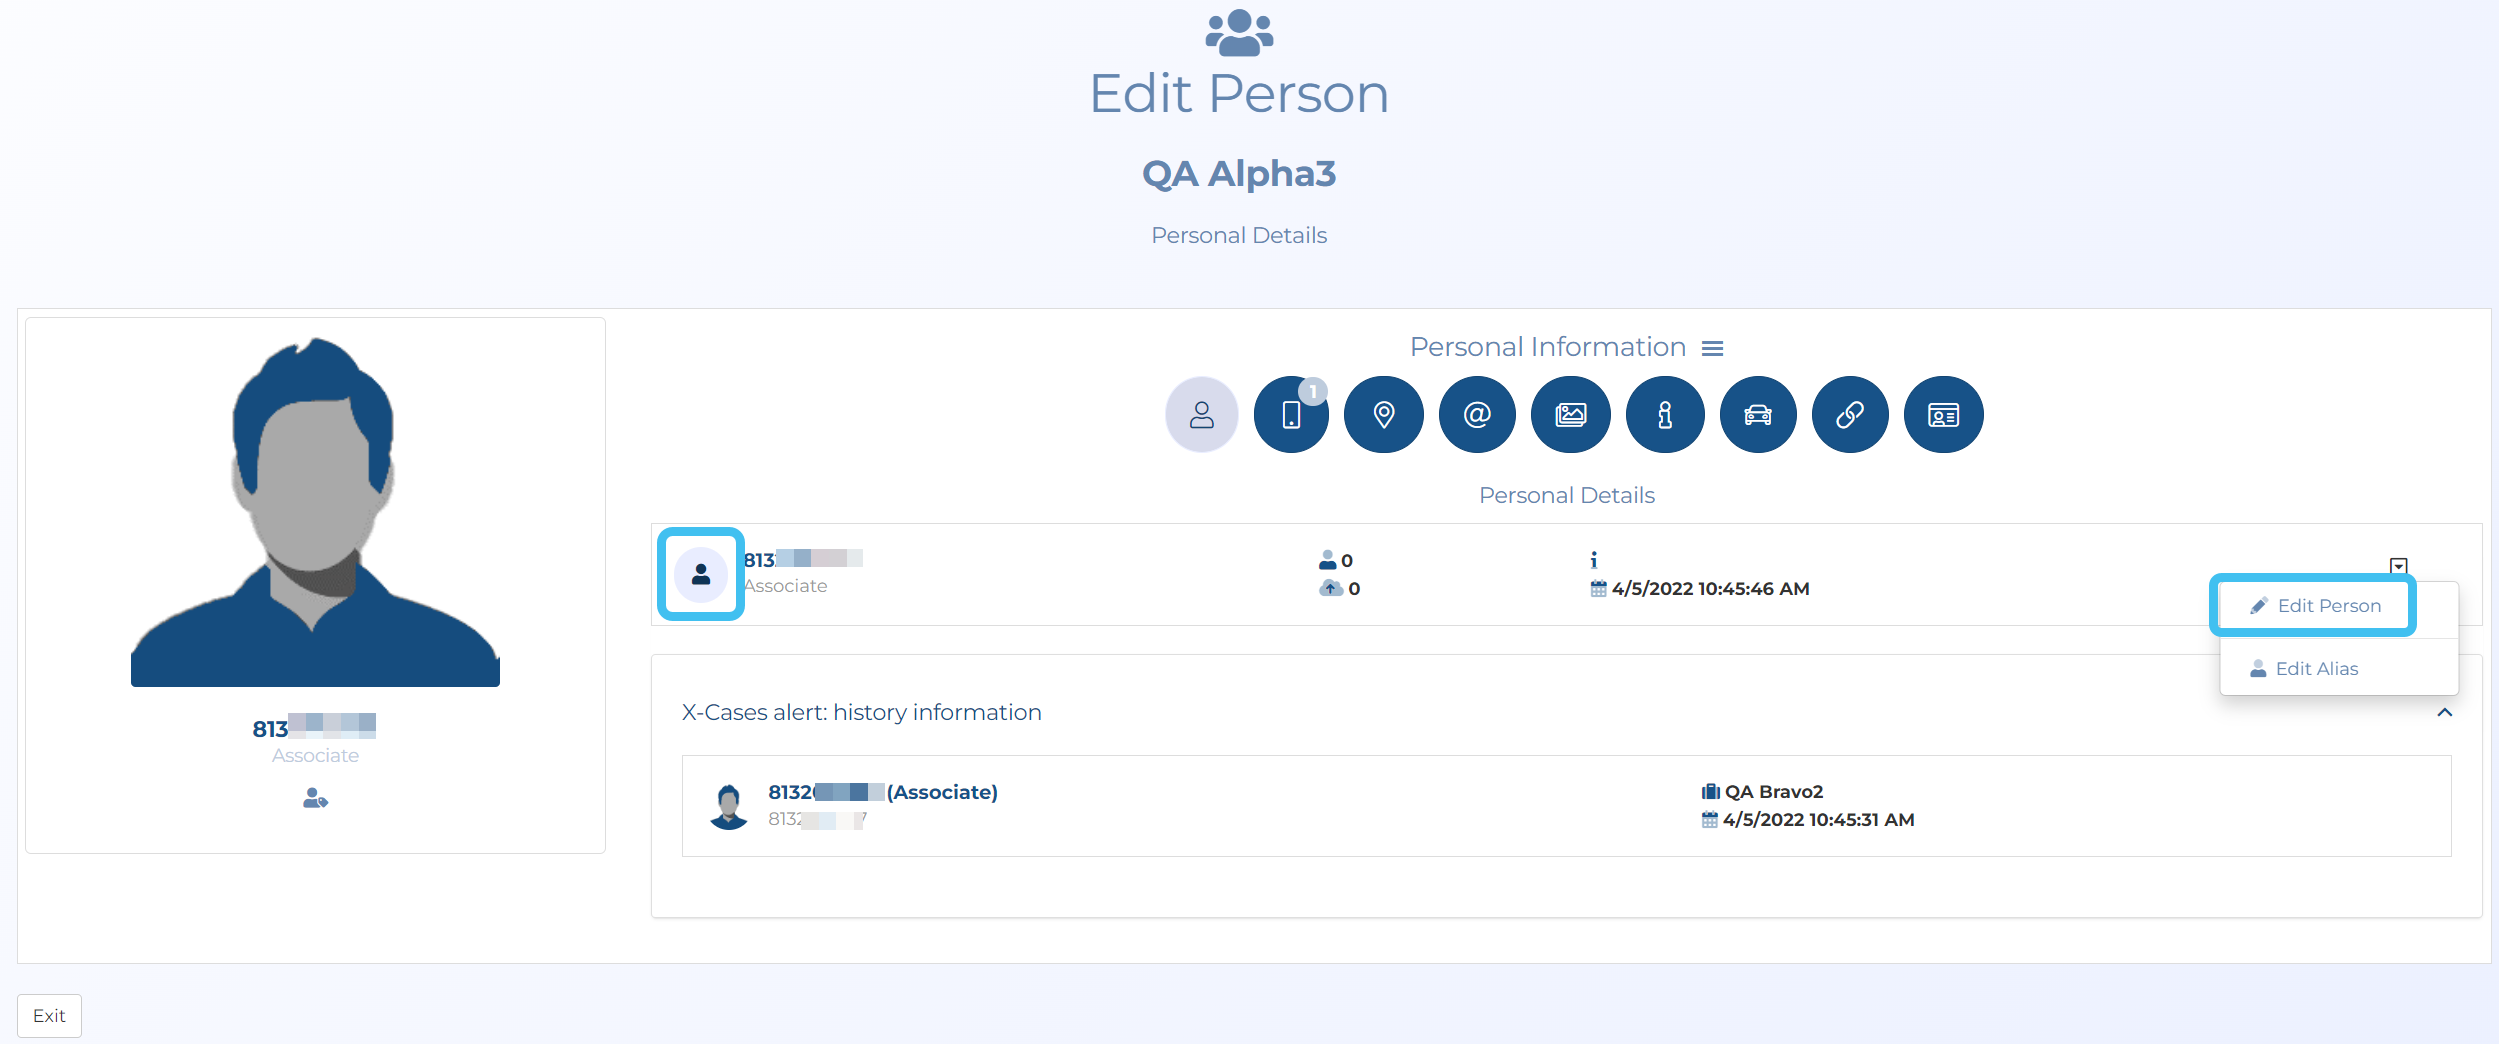


 .
.
 .
.

 .
. .
.
 to open the
  at the top-right of the screen to open either the
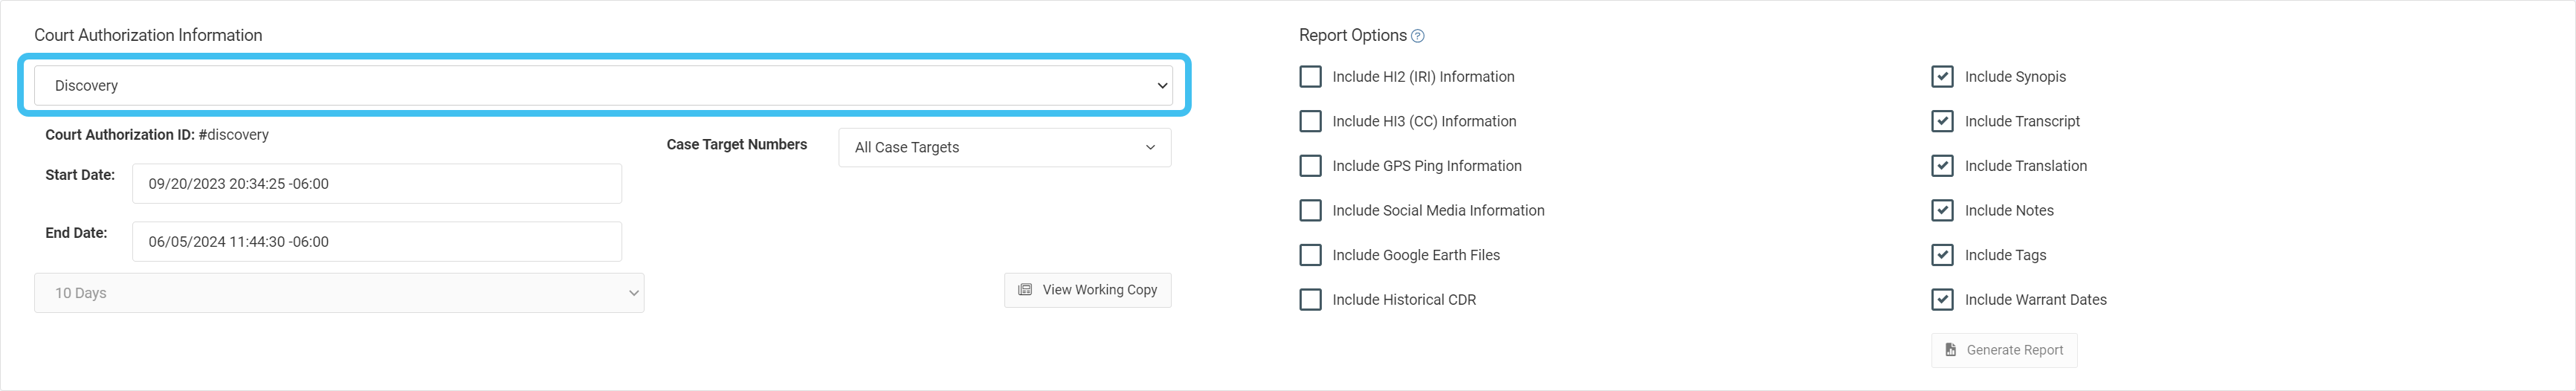
 .
.
 , or select an individual number to log in to by clicking
  .
. 
 to minimize the call if the discussion is not relevant. This pauses the call for a number of seconds and places "minimized" sounds on the recording trace.
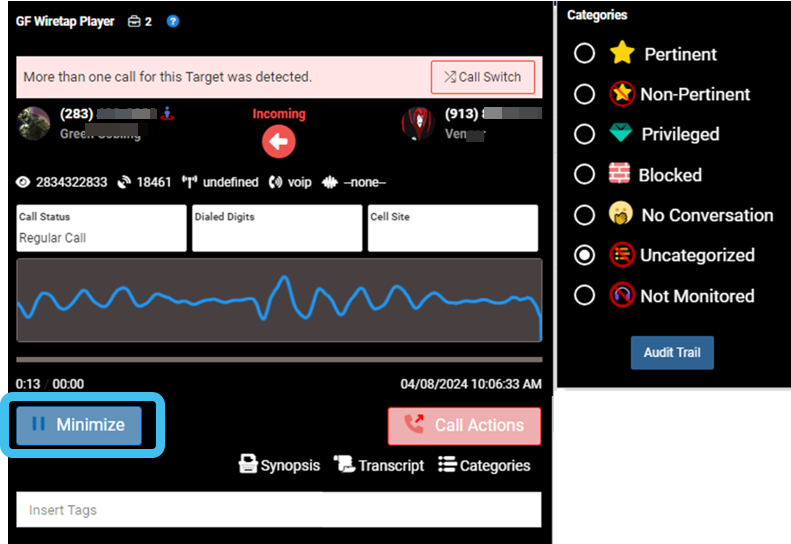
 then select
  to terminate the call monitoring. You may want to terminate the call if it is privileged, not pertinent, or if another call has started that is a higher priority for you to monitor.
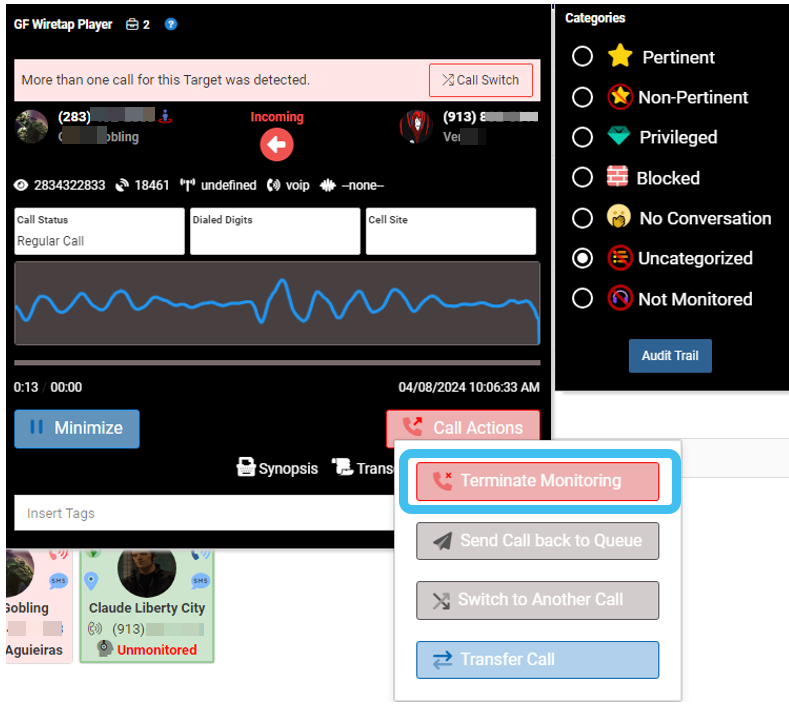
 to transfer the call to another monitor if you have to attend to something more urgent.
  to open the
  to switch to another call. Currently the
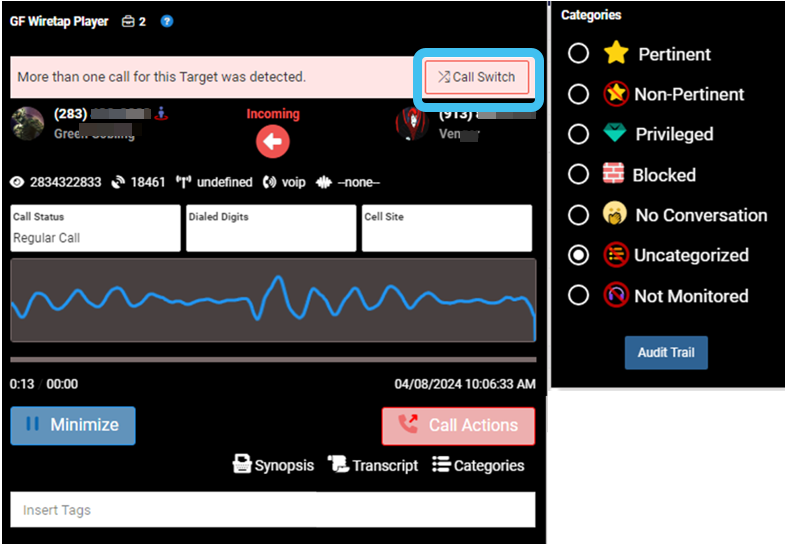
 indicates that you are logged into the queue and monitoring the subject.
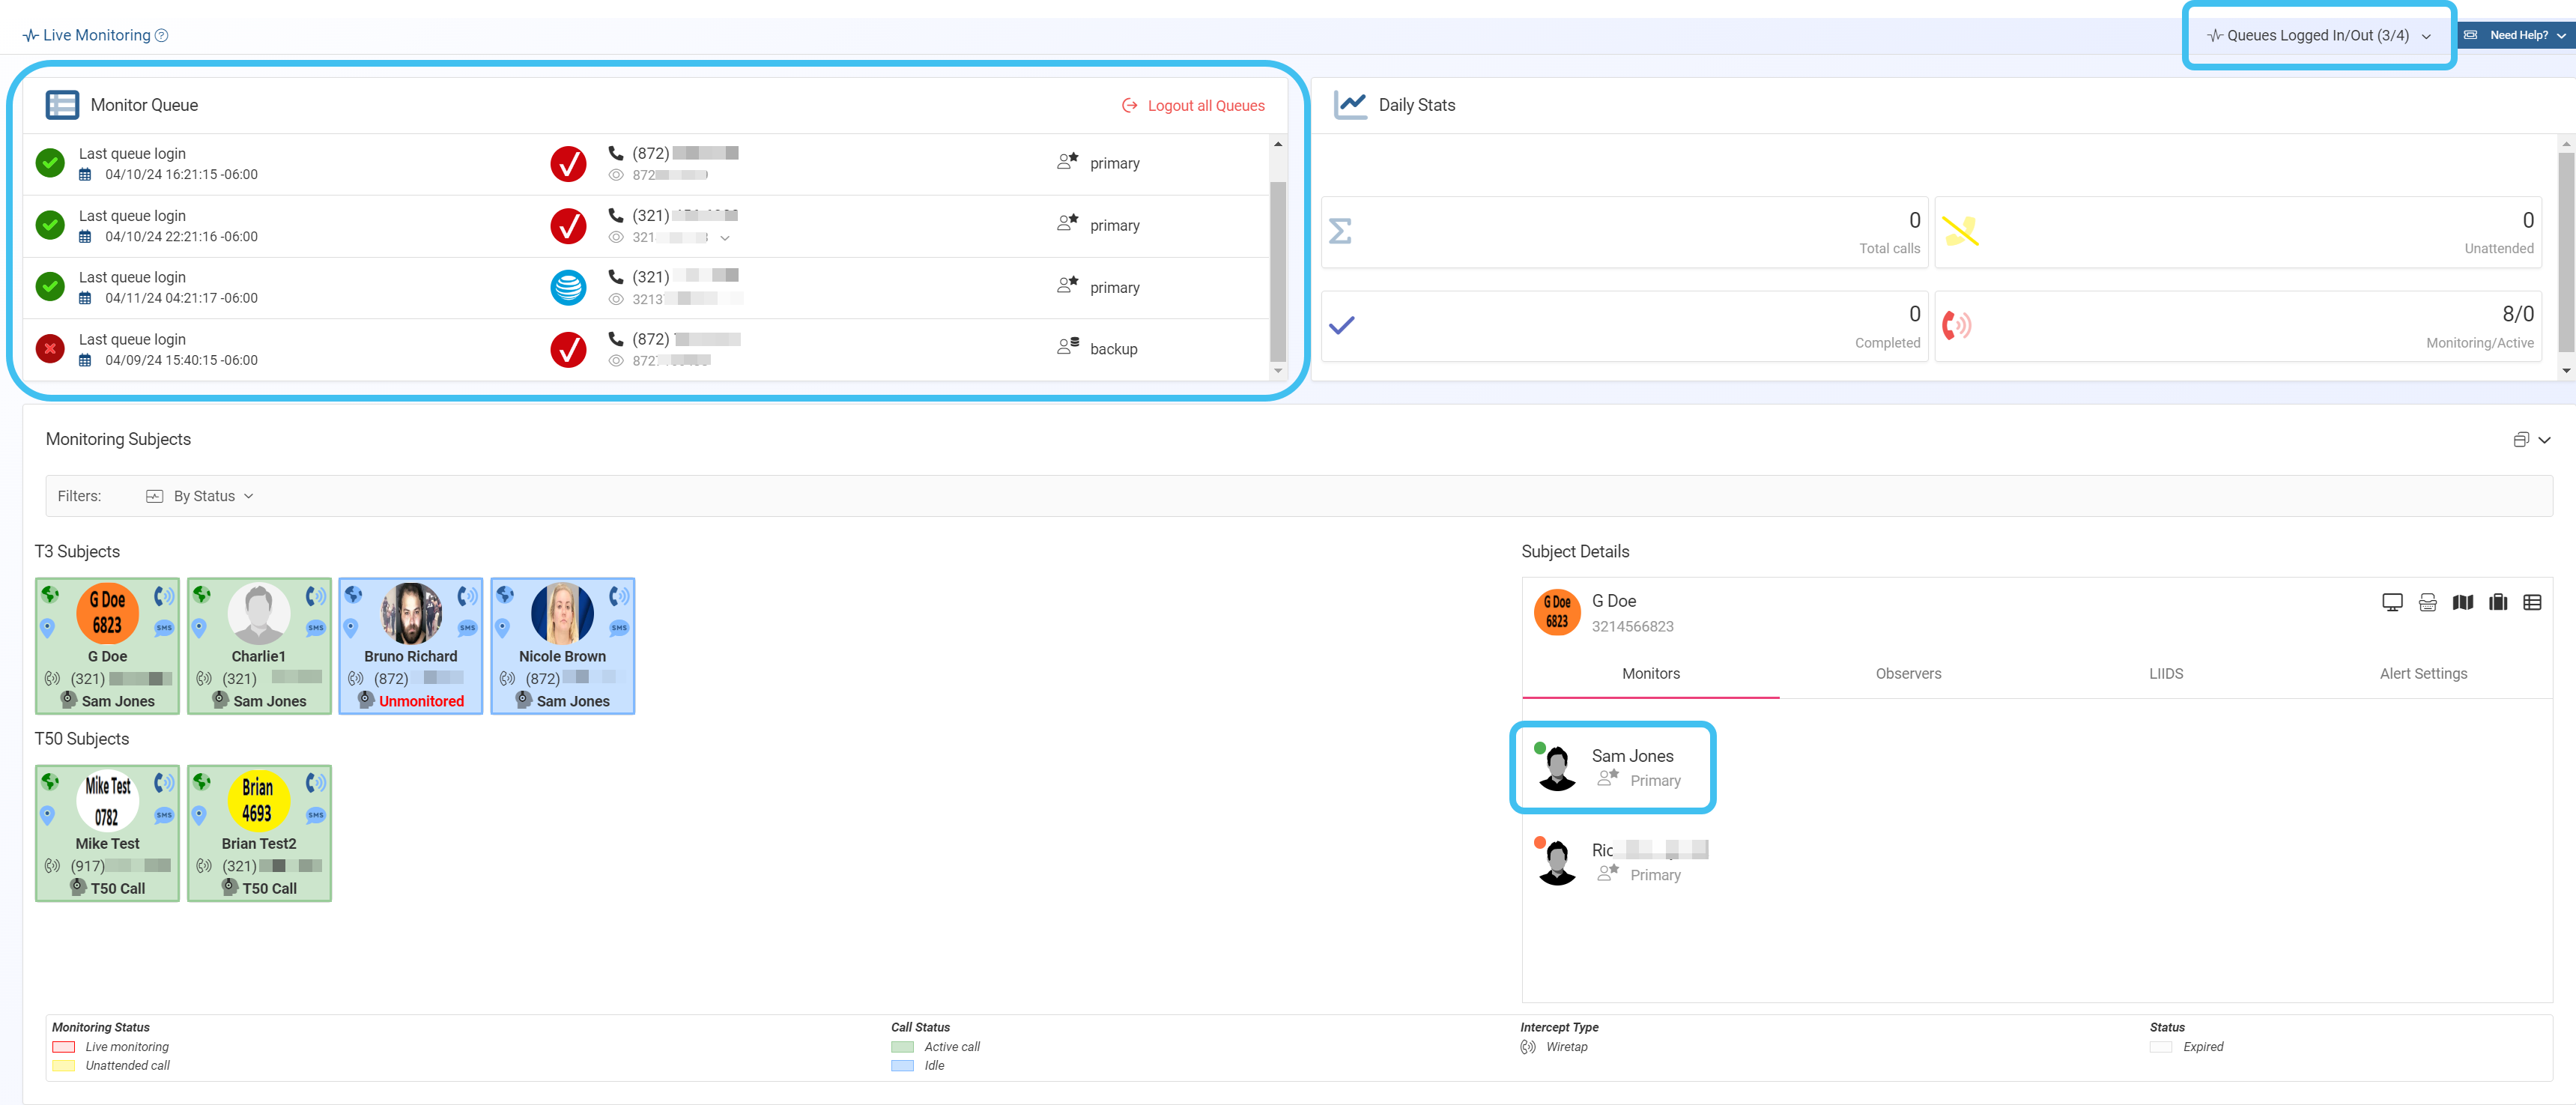
 , then click
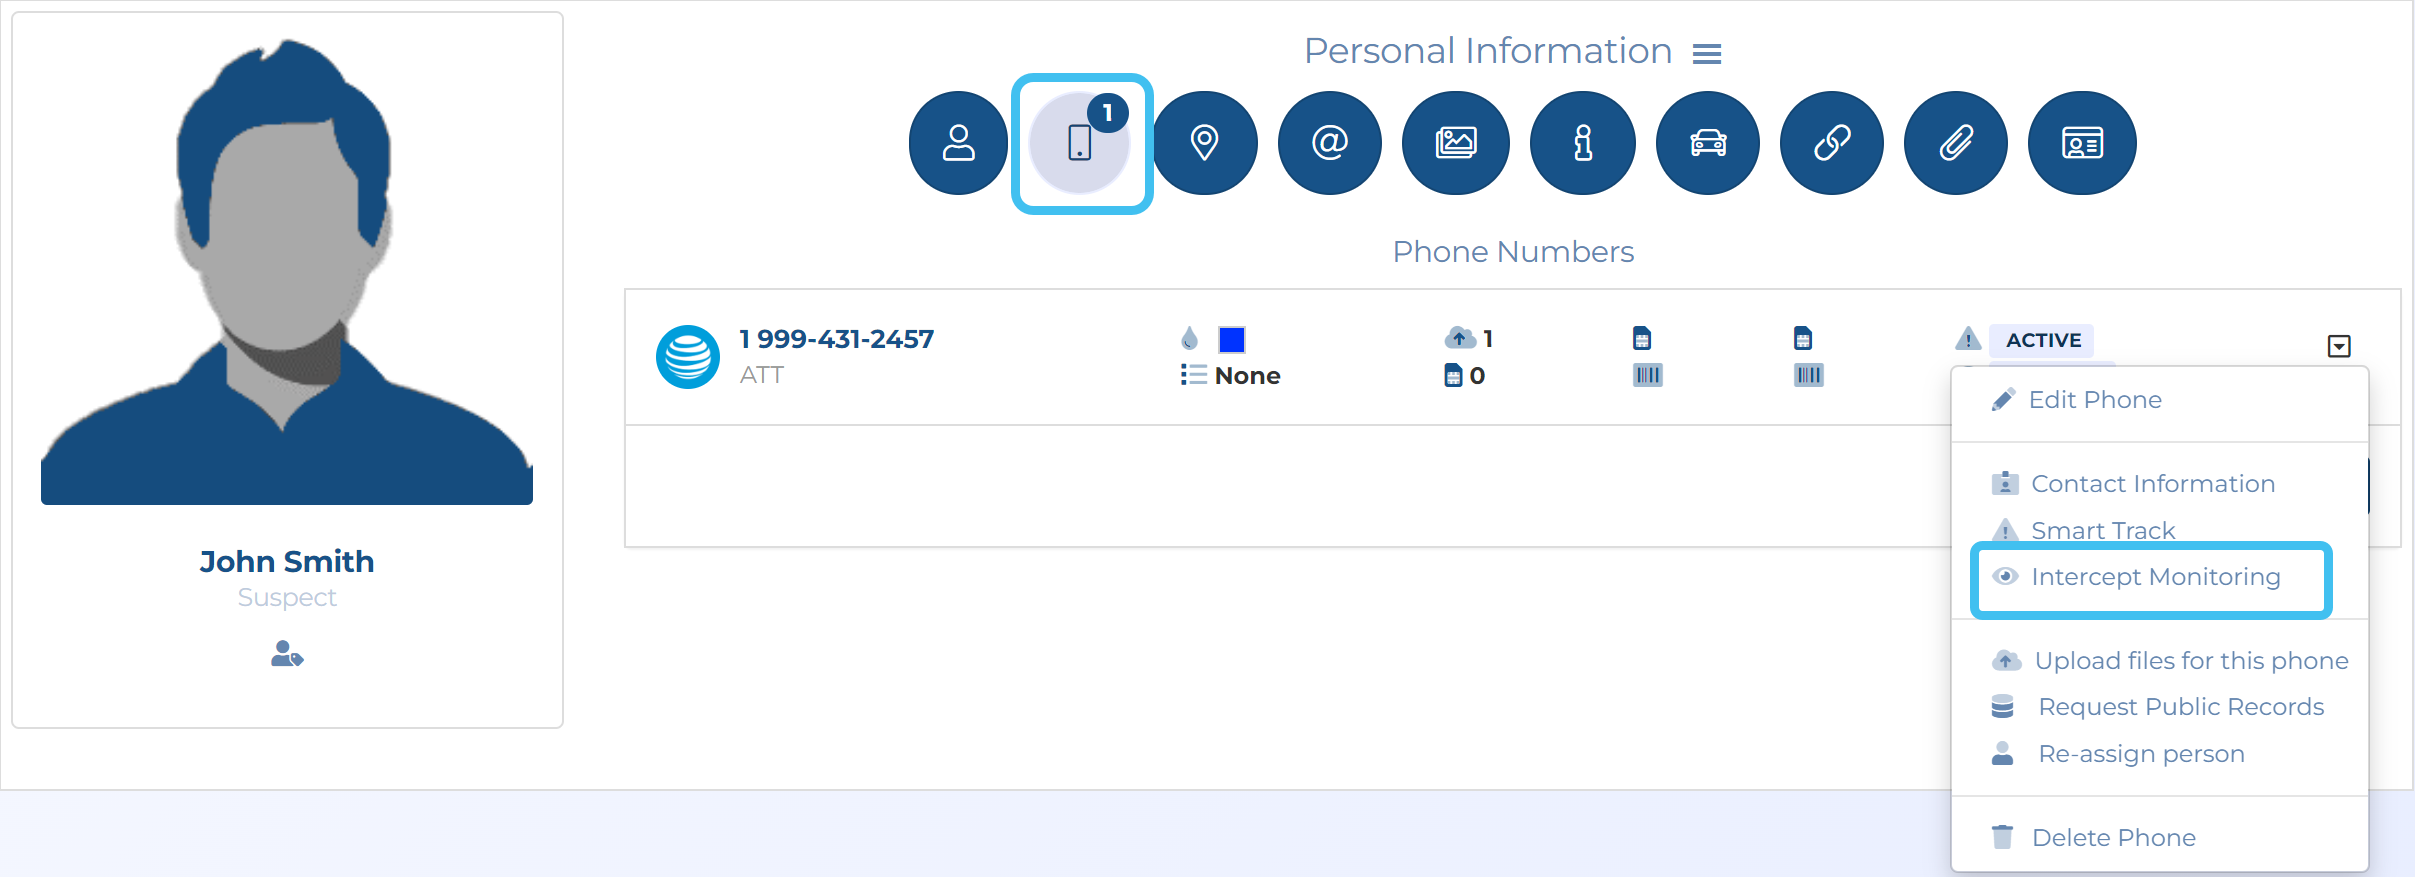
 .
. .
.
 ,
,  or
or  in the